Dollar General (DG)
(Delayed Data from NYSE)
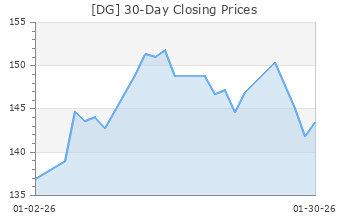
$86.50 USD
-0.36 (-0.41%)
Updated Sep 19, 2024 04:02 PM ET
After-Market: $86.52 +0.02 (0.02%) 7:58 PM ET
5-Strong Sell of 5 5
A Value B Growth F Momentum A VGM
Company Summary
Headquartered in Goodlettsville, Tennessee, Dollar General Corporation is one of the largest discount retailers in the United States. The company trades in low priced merchandise typically $10 or less.
The company offer a wider selection of merchandise, including consumable items, seasonal items, home products and apparel. The company's merchandise comprises national brands from leading manufacturers, as well as own private brand selections with prices at substantial discounts to national brands.
As of May 3, 2024, Dollar General operated approximately 20,149 stores across 48 U.S. states and Mexico. It offers general merchandise under four categories, namely, ...
Company Summary
Headquartered in Goodlettsville, Tennessee, Dollar General Corporation is one of the largest discount retailers in the United States. The company trades in low priced merchandise typically $10 or less.
The company offer a wider selection of merchandise, including consumable items, seasonal items, home products and apparel. The company's merchandise comprises national brands from leading manufacturers, as well as own private brand selections with prices at substantial discounts to national brands.
As of May 3, 2024, Dollar General operated approximately 20,149 stores across 48 U.S. states and Mexico. It offers general merchandise under four categories, namely, Consumables, Seasonal, Home products and Apparel.
Consumables Category (81% of Fiscal 2023 Sales) is the leading one, consisting of paper and cleaning products, health & beauty products, snacks, perishables, packaged foods, pet and tobacco products.
Seasonal Category (10.6% of Fiscal 2023 Sales) consists of holiday items, toys, batteries, small electronics, greeting cards, stationery, prepaid phones and accessories, gardening supplies, hardware, automotive and home office supplies.
Home Products Category (5.6% of Fiscal 2023 Sales) includes kitchen supplies, cookware, small appliances, light bulbs, storage containers, frames, candles, craft supplies and kitchen, bed and bath soft goods.
Apparel Category (2.8% of Fiscal 2023 Sales) offers casual everyday apparel for infants, toddlers, girls, boys, women and men, as well as socks, underwear, disposable diapers, shoes and accessories.
Seasonal and Home Products categories typically account for the highest gross profit margins, and the Consumables category accounts for the lowest gross profit margin.
(Notes: Zacks identifies fiscal years by the month in which the fiscal year ends, while DG identifies its fiscal year by the calendar year in which it begins; so comparable figures for any given fiscal year, as published by DG, will refer to this same fiscal year as being the year before the same year, as identified by Zacks.)
General Information
Dollar General Corporation
100 MISSION RIDGE
GOODLETTSVILLE, TN 37072
Phone: 615-855-4000
Fax: 615-386-9936
Web: http://www.dollargeneral.com
Email: investorrelations@dollargeneral.com
| Industry | Retail - Discount Stores |
| Sector | Retail-Wholesale |
| Fiscal Year End | January |
| Last Reported Quarter | 7/31/2024 |
| Exp Earnings Date | 12/5/2024 |
EPS Information
| Current Quarter EPS Consensus Estimate | 1.02 |
| Current Year EPS Consensus Estimate | 5.95 |
| Estimated Long-Term EPS Growth Rate | 5.80 |
| Exp Earnings Date | 12/5/2024 |
Price and Volume Information
| Zacks Rank | |
| Yesterday's Close | 86.86 |
| 52 Week High | 168.07 |
| 52 Week Low | 77.96 |
| Beta | 0.44 |
| 20 Day Moving Average | 7,433,889.50 |
| Target Price Consensus | 102.88 |
| 4 Week | -29.79 |
| 12 Week | -32.67 |
| YTD | -36.11 |
| 4 Week | -29.76 |
| 12 Week | -34.35 |
| YTD | -45.76 |
| Shares Outstanding (millions) | 219.91 |
| Market Capitalization (millions) | 19,101.83 |
| Short Ratio | NA |
| Last Split Date | NA |
| Dividend Yield | 2.72% |
| Annual Dividend | $2.36 |
| Payout Ratio | 0.37 |
| Change in Payout Ratio | 0.15 |
| Last Dividend Payout / Amount | 7/8/2024 / $0.59 |
Fundamental Ratios
| P/E (F1) | 14.59 |
| Trailing 12 Months | 13.49 |
| PEG Ratio | 2.50 |
| vs. Previous Year | -20.19% |
| vs. Previous Quarter | 3.03% |
| vs. Previous Year | 4.23% |
| vs. Previous Quarter | 2.99% |
| Price/Book | 2.63 |
| Price/Cash Flow | 7.60 |
| Price / Sales | 0.48 |
| 7/31/24 | 20.62 |
| 4/30/24 | 22.80 |
| 1/31/24 | 26.13 |
| 7/31/24 | 4.56 |
| 4/30/24 | 4.92 |
| 1/31/24 | 5.46 |
| 7/31/24 | 1.22 |
| 4/30/24 | 1.22 |
| 1/31/24 | 1.19 |
| 7/31/24 | 0.24 |
| 4/30/24 | 0.18 |
| 1/31/24 | 0.15 |
| 7/31/24 | 3.57 |
| 4/30/24 | 3.85 |
| 1/31/24 | 4.29 |
| 7/31/24 | 3.57 |
| 4/30/24 | 3.85 |
| 1/31/24 | 4.29 |
| 7/31/24 | 4.56 |
| 4/30/24 | 4.93 |
| 1/31/24 | 5.48 |
| 7/31/24 | 33.01 |
| 4/30/24 | 31.83 |
| 1/31/24 | 30.75 |
| 7/31/24 | 3.95 |
| 4/30/24 | 3.82 |
| 1/31/24 | 3.69 |
| 7/31/24 | 0.86 |
| 4/30/24 | 0.89 |
| 1/31/24 | 0.92 |
| 7/31/24 | 46.20 |
| 4/30/24 | 47.06 |
| 1/31/24 | 48.01 |