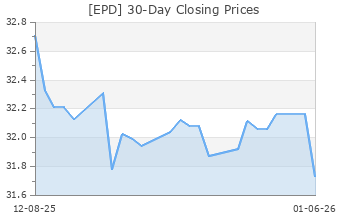
Enterprise Products Partners (EPD)
(Real Time Quote from BATS)
$29.07 USD
+0.14 (0.48%)
Updated Apr 26, 2024 03:11 PM ET
3-Hold of 5 3
B Value B Growth A Momentum A VGM
Company Summary
Headquartered in Houston, TX, Enterprise Products Partners is among the leading midstream energy players in North America. With its wide base of midstream infrastructure assets, the partnership provides services to producers and consumers of commodities that include natural gas, natural gas liquids (NGL), oil and refined petrochemical products. It was formed in April 1998.
Enterprise has an extensive network of pipeline that spreads across more than 50,000 miles. The pipelines carry natural gas, NGL, crude oil and refined products. The storage assets have the capacity to store 14 billion cubic feet (Bcf) of natural gas and more than 300 ...
Company Summary
Headquartered in Houston, TX, Enterprise Products Partners is among the leading midstream energy players in North America. With its wide base of midstream infrastructure assets, the partnership provides services to producers and consumers of commodities that include natural gas, natural gas liquids (NGL), oil and refined petrochemical products. It was formed in April 1998.
Enterprise has an extensive network of pipeline that spreads across more than 50,000 miles. The pipelines carry natural gas, NGL, crude oil and refined products. The storage assets have the capacity to store 14 billion cubic feet (Bcf) of natural gas and more than 300 million barrels (MMBbls) of NGLs, crude oil, petrochemicals and refined products. The partnership’s assets include 19 gas processing units, 25 fractionators and 11 condensate distillation facilities.
Enterprise divides its operations into four segments — NGL Pipelines & Services, Crude Oil Pipelines & Services, Natural Gas Pipelines & Services and Petrochemical & Refined Products Services.
NGL Pipelines & Services: This segment incorporates 26 natural gas processing plants and around 19,200 miles of NGL pipelines. It also owns 16 NGL fractionators and LPG and ethane export terminals.
Crude Oil Pipelines & Services: This segment includes about 5,300 miles of crude oil pipelines, several crude oil storage and marine terminals. Through this segment, the partnership performs various crude oil marketing activities. It has 28.2 million barrels of operational storage capacity.
Natural Gas Pipelines & Services: It includes around 19,700 miles of natural gas pipeline systems as well as related marketing activities.
Petrochemical & Refined Products Services: This segment incorporates propylene production facilities and around 800 miles of pipelines. It also owns a butane isomerization complex and almost 70 miles of associated pipelines. Notably, the segment has refined product pipelines of 4,100 miles and marine transportation activities.
General Information
Enterprise Products Partners LP
1100 Louisiana Street 10th Floor
HOUSTON, TX 77002
Phone: 713-381-6500
Fax: 713-381-8200
Web: http://www.enterpriseproducts.com
Email: investor.relations@eprod.com
| Industry | Oil and Gas - Production Pipeline - MLB |
| Sector | Oils-Energy |
| Fiscal Year End | December |
| Last Reported Quarter | 3/31/2024 |
| Exp Earnings Date | 5/7/2024 |
EPS Information
| Current Quarter EPS Consensus Estimate | 0.64 |
| Current Year EPS Consensus Estimate | 2.63 |
| Estimated Long-Term EPS Growth Rate | NA |
| Exp Earnings Date | 5/7/2024 |
Price and Volume Information
| Zacks Rank | |
| Yesterday's Close | 28.93 |
| 52 Week High | 29.99 |
| 52 Week Low | 25.19 |
| Beta | 1.02 |
| 20 Day Moving Average | 4,698,358.00 |
| Target Price Consensus | 32.56 |

| 4 Week | -0.86 |
| 12 Week | 7.95 |
| YTD | 9.79 |
| 4 Week | 3.19 |
| 12 Week | 4.91 |
| YTD | 3.73 |
| Shares Outstanding (millions) | 2,168.25 |
| Market Capitalization (millions) | 62,727.34 |
| Short Ratio | NA |
| Last Split Date | 8/22/2014 |
| Dividend Yield | 7.12% |
| Annual Dividend | $2.06 |
| Payout Ratio | 0.79 |
| Change in Payout Ratio | -0.02 |
| Last Dividend Payout / Amount | 1/30/2024 / $0.51 |
Fundamental Ratios
| P/E (F1) | 10.98 |
| Trailing 12 Months | 11.44 |
| PEG Ratio | NA |
| vs. Previous Year | 10.77% |
| vs. Previous Quarter | 20.00% |
| vs. Previous Year | 7.12% |
| vs. Previous Quarter | 21.87% |
| Price/Book | 2.18 |
| Price/Cash Flow | 7.97 |
| Price / Sales | 1.26 |
| 3/31/24 | NA |
| 12/31/23 | 19.65 |
| 9/30/23 | 19.32 |
| 3/31/24 | NA |
| 12/31/23 | 8.04 |
| 9/30/23 | 7.91 |
| 3/31/24 | NA |
| 12/31/23 | 0.93 |
| 9/30/23 | 0.92 |
| 3/31/24 | NA |
| 12/31/23 | 0.68 |
| 9/30/23 | 0.65 |
| 3/31/24 | NA |
| 12/31/23 | 11.15 |
| 9/30/23 | 11.08 |
| 3/31/24 | NA |
| 12/31/23 | 11.12 |
| 9/30/23 | 11.04 |
| 3/31/24 | NA |
| 12/31/23 | 11.47 |
| 9/30/23 | 11.45 |
| 3/31/24 | NA |
| 12/31/23 | 13.24 |
| 9/30/23 | 12.99 |
| 3/31/24 | NA |
| 12/31/23 | 15.11 |
| 9/30/23 | 15.94 |
| 3/31/24 | NA |
| 12/31/23 | 0.95 |
| 9/30/23 | 0.97 |
| 3/31/24 | NA |
| 12/31/23 | 48.88 |
| 9/30/23 | 49.35 |

