FedEx (FDX)
(Real Time Quote from BATS)
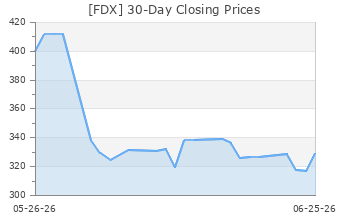
$257.82 USD
-42.57 (-14.17%)
Updated Sep 20, 2024 12:08 PM ET
3-Hold of 5 3
A Value C Growth F Momentum B VGM
Company Summary
Based in Memphis, TN, FedEx Corporation is the leader in global express delivery services. The company, founded in 1971, provides a broad portfolio of transportation, e-commerce and business services through companies competing collectively, operating independently and managed collaboratively, under the FedEx brand. The company is currently reporting, primarily through the FedEx Express , FedEx Ground, FedEx Freight and FedEx Services segments. These segments contributed 47.4%, 37.2% and 10.7% respectively to the company’s total revenues in fiscal 2023. The FedEx Services segment accounted for the balance.
FedEx Express offers time-definite delivery to more than 220 countries and territories, connecting markets ...
Company Summary
Based in Memphis, TN, FedEx Corporation is the leader in global express delivery services. The company, founded in 1971, provides a broad portfolio of transportation, e-commerce and business services through companies competing collectively, operating independently and managed collaboratively, under the FedEx brand. The company is currently reporting, primarily through the FedEx Express , FedEx Ground, FedEx Freight and FedEx Services segments. These segments contributed 47.4%, 37.2% and 10.7% respectively to the company’s total revenues in fiscal 2023. The FedEx Services segment accounted for the balance.
FedEx Express offers time-definite delivery to more than 220 countries and territories, connecting markets that comprise almost the entire gross domestic product of the world.
FedEx Ground offers low-cost, day-certain service to any business address in the United States and Canada, as well as residential delivery in the United States through its FedEx Home Delivery service.
FedEx SmartPost is an offering of the FedEx Ground segment that focuses in the consolidation and delivery of high volumes of low-weight, less time-sensitive business-to-consumer packages.
Through the FedEx Freight segment, the company offers less-than-truckload (“LTL”) freight services in the United States. The division also offers freight delivery service to destinations in Canada, Mexico, Puerto Rico and the U.S. Virgin Islands. At the end of fiscal 2023 (ended May 31, 2023, the segment operated approximately 30,000 vehicles and nearly 390 service centers.
Through the FedEx Services segment, which includes FedEx office and print services, the company offers various services like sales, marketing, information technology, billing and collection.
In 2023, management announced a segment restructuring plan aimed at saving costs. The entire restructuring process is likely to be implemented in June 2024. Following the revamp, FedEx Express, FedEx Ground, FedEx Services, and other FedEx operating companies will come under a single umbrella — Federal Express Corporation. Federal Express Corporation will conduct all its operations under the FedEx brand. The company is assessing the role of the Freight unit in its portfolio.
FDX’s current CEO Raj Subramaniam will serve as president and CEO of the revamped organization.
General Information
FedEx Corporation
942 SOUTH SHADY GROVE ROAD
MEMPHIS, TN 38120
Phone: 901-818-7500
Fax: NA
Web: http://www.fedex.com
Email: ir@fedex.com
| Industry | Transportation - Air Freight and Cargo |
| Sector | Transportation |
| Fiscal Year End | May |
| Last Reported Quarter | 8/31/2024 |
| Exp Earnings Date | 12/17/2024 |
EPS Information
| Current Quarter EPS Consensus Estimate | 4.32 |
| Current Year EPS Consensus Estimate | 20.66 |
| Estimated Long-Term EPS Growth Rate | 12.70 |
| Exp Earnings Date | 12/17/2024 |
Price and Volume Information
| Zacks Rank | |
| Yesterday's Close | 300.39 |
| 52 Week High | 313.84 |
| 52 Week Low | 224.69 |
| Beta | 1.17 |
| 20 Day Moving Average | 944,395.38 |
| Target Price Consensus | 322.68 |
| 4 Week | 2.08 |
| 12 Week | 1.67 |
| YTD | 18.75 |
| 4 Week | -0.48 |
| 12 Week | -2.44 |
| YTD | 0.07 |
| Shares Outstanding (millions) | 244.30 |
| Market Capitalization (millions) | 73,385.95 |
| Short Ratio | NA |
| Last Split Date | 5/7/1999 |
| Dividend Yield | 1.84% |
| Annual Dividend | $5.52 |
| Payout Ratio | 0.28 |
| Change in Payout Ratio | 0.06 |
| Last Dividend Payout / Amount | 9/9/2024 / $2.76 |
Fundamental Ratios
| P/E (F1) | 14.54 |
| Trailing 12 Months | 17.82 |
| PEG Ratio | 1.15 |
| vs. Previous Year | 9.51% |
| vs. Previous Quarter | 40.16% |
| vs. Previous Year | 0.82% |
| vs. Previous Quarter | 1.88% |
| Price/Book | 2.68 |
| Price/Cash Flow | 8.28 |
| Price / Sales | 0.84 |
| 8/31/24 | Pending Next EPS Report |
| 5/31/24 | 16.70 |
| 2/29/24 | 16.60 |
| 8/31/24 | Pending Next EPS Report |
| 5/31/24 | 5.14 |
| 2/29/24 | 5.03 |
| 8/31/24 | Pending Next EPS Report |
| 5/31/24 | 1.36 |
| 2/29/24 | 1.31 |
| 8/31/24 | Pending Next EPS Report |
| 5/31/24 | 1.32 |
| 2/29/24 | 1.26 |
| 8/31/24 | Pending Next EPS Report |
| 5/31/24 | 5.11 |
| 2/29/24 | 5.02 |
| 8/31/24 | Pending Next EPS Report |
| 5/31/24 | 4.94 |
| 2/29/24 | 5.02 |
| 8/31/24 | Pending Next EPS Report |
| 5/31/24 | 6.66 |
| 2/29/24 | 6.79 |
| 8/31/24 | Pending Next EPS Report |
| 5/31/24 | 112.08 |
| 2/29/24 | 107.18 |
| 8/31/24 | Pending Next EPS Report |
| 5/31/24 | 40.73 |
| 2/29/24 | 40.60 |
| 8/31/24 | Pending Next EPS Report |
| 5/31/24 | 0.73 |
| 2/29/24 | 0.76 |
| 8/31/24 | Pending Next EPS Report |
| 5/31/24 | 42.20 |
| 2/29/24 | 43.28 |