Fidelity National Financial (FNF)
(Real Time Quote from BATS)
$60.55 USD
-0.42 (-0.69%)
Updated Sep 24, 2024 11:50 AM ET
3-Hold of 5 3
A Value B Growth F Momentum B VGM
FNF Group (FNF) Price Targets
| Average Price Target | Highest Price Target | Lowest Price Target | Upside to Average Price Target |
|---|---|---|---|
| $61.17 | $64.00 | $56.00 | 0.33% |
Price Target
Based on short-term price targets offered by six analysts, the average price target for FNF Group comes to $61.17. The forecasts range from a low of $56.00 to a high of $64.00. The average price target represents an increase of 0.33% from the last closing price of $60.97.
Analyst Price Targets (6 )
Broker Rating
FNF Group currently has an average brokerage recommendation (ABR) of 2.14 on a scale of 1 to 5 (Strong Buy to Strong Sell), calculated based on the actual recommendations (Buy, Hold, Sell etc.) made by seven brokerage firms. The current ABR compares to an ABR of 2.14 a month ago based on seven recommendations.
Of the seven recommendations deriving the current ABR, three are Strong Buy, representing 42.86% of all recommendations. A month ago, Strong Buy represented 42.86%.
Broker Rating Breakdown
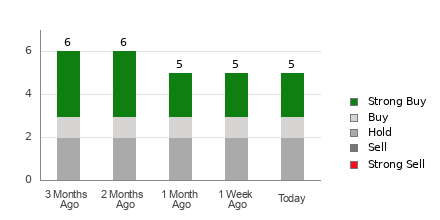
Brokerage Recommendations
| Today | 1 Week Ago | 1 Month Ago | 2 Months Ago | 3 Months Ago | |
|---|---|---|---|---|---|
| Strong Buy | 3 | 3 | 3 | 3 | 3 |
| Buy | 0 | 0 | 0 | 0 | 0 |
| Hold | 4 | 4 | 4 | 4 | 3 |
| Sell | 0 | 0 | 0 | 0 | 0 |
| Strong Sell | 0 | 0 | 0 | 0 | 0 |
| ABR | 2.14 | 2.14 | 2.14 | 2.14 | 2.00 |
1. Not Ident. Many of the brokerage firms who provide Zacks data ask that we keep their identity confidential.
2. In most cases the # of brokers listed above is less than the # of brokerage firms that have a recommendation on the stock. That is because some firms prohibit Zacks from displaying detailed information on their recommendations such as in the upgrade/downgrade table.
Analyst Upgrades/Downgrades
| Date | Brokerage Firm | Analyst | Previous | Current |
|---|---|---|---|---|
| 8/15/2024 | Stephens | John Campbell | Strong Buy | Strong Buy |
| 8/7/2024 | Truist Securities | Mark D Hughes | Strong Buy | Strong Buy |
| 8/7/2024 | Not Identified | Not Identified | Hold | Hold |
| 7/9/2024 | Dowling & Partners | Geoffrey M Dunn | Not Available | Hold |
| 7/2/2024 | Keefe Bruyette & Woods | Bose T George | Hold | Hold |
| 2/27/2024 | BTIG | Soham Bhonsle | Strong Buy | Strong Buy |
1. Not Ident. Many of the brokerage firms who provide Zacks data ask that we keep their identity confidential.
2. In most cases the # of brokers listed above is less than the # of brokerage firms that have a recommendation on the stock. That is because some firms prohibit Zacks from displaying detailed information on their recommendations such as in the upgrade/downgrade table.
Average Brokerage Rating
| Current ABR | 2.14 |
| ABR (Last week) | 2.14 |
| # of Recs in ABR | 7 |
| Average Target Price | $61.17 |
| LT Growth Rate | NA |
| Industry | Insurance - Property and Casualty |
| Industry Rank by ABR | 20 of 253 |
| Current Quarter EPS Est: | 1.39 |
FNF FAQs
Fidelity National Financial, Inc. (FNF) currently has an average brokerage recommendation (ABR) of 2.14 on a scale of 1 to 5 (Strong Buy to Strong Sell), calculated based on the actual recommendations (Buy, Hold, Sell etc.) made by 7 brokerage firms.
The average price target for Fidelity National Financial, Inc. (FNF) is $61.17. The current on short-term price targets is based on 3 reports.
The forecasts for Fidelity National Financial, Inc. (FNF) range from a low of $56 to a high of $64. The average price target represents a increase of $0.33 from the last closing price of $60.97.
The current UPSIDE for Fidelity National Financial, Inc. (FNF) is 0.33%
Based on short-term price targets offered by six analysts, the average price target for FNF Group comes to $61.17. The forecasts range from a low of $56.00 to a high of $64.00. The average price target represents an increase of 0.33% from the last closing price of $60.97.