Transocean (RIG)
(Delayed Data from NYSE)
$4.54 USD
0.00 (0.00%)
Updated Sep 20, 2024 04:00 PM ET
After-Market: $4.53 -0.01 (-0.22%) 7:58 PM ET
3-Hold of 5 3
C Value C Growth D Momentum D VGM
Company Summary
Switzerland-based Transocean, Inc. is the world’s largest offshore drilling contractor and leading provider of drilling management services. The company provide rigs on a contractual basis to explore and develop oil and gas. Transocean offers offshore drilling rigs, equipment, services and manpower (with particular emphasis on ultra-deepwater and harsh environment drilling services) to exploration and production companies worldwide.
Transocean's fleet is considered one of the most modern and versatile in the world due to its emphasis on technically demanding segments of the offshore drilling business. Transocean’s fleet ...
Company Summary
Switzerland-based Transocean, Inc. is the world’s largest offshore drilling contractor and leading provider of drilling management services. The company provide rigs on a contractual basis to explore and develop oil and gas. Transocean offers offshore drilling rigs, equipment, services and manpower (with particular emphasis on ultra-deepwater and harsh environment drilling services) to exploration and production companies worldwide.
Transocean's fleet is considered one of the most modern and versatile in the world due to its emphasis on technically demanding segments of the offshore drilling business. Transocean’s fleet can be broadly divided into two distinct groups based on drilling capabilities: ultra-deepwater floaters and harsh environment floaters, which accounted for 73% and 27%, respectively, of its contract drilling revenue for 2023.
Transocean’s ultra-deepwater floaters are capable of drilling in water depths of 4,500 feet and more. The company’s harsh environment floaters are capable of drilling in harsh environment at water depths between 1,500 and 10,000 feet with greater displacement.
Apart from its fleet of 37 mobile offshore drilling units, one ultra-deepwater drillship is currently under construction. Transocean's fleet is considered one of the most modern and versatile in the world due to its emphasis on technically demanding segments of the offshore drilling business.
Songa & Ocean Rig Acquisitions
In early 2018, Transocean acquired Norway-based drilling contractor Songa Offshore for $3.4 billion. As a result of the transaction, the company got seven mobile offshore drilling units, including five harsh environment floaters and two midwater floaters.
In December 2018, Transocean snapped up smaller rival Ocean Rig UDW for $2.7-billion. The deal further strengthened its portfolio, in turn expanding fleet size and quality. Notably, the acquisition gave Transocean 11 mobile offshore drilling units, including nine ultra-deepwater floaters and two harsh environment floaters.
General Information
Transocean Ltd
Turmstrasse30
Steinhausen, V8 6312
Phone: 41-41-749-0500
Fax: 41 71 323 27 750
Email: alison.johnson@deepwater.com
| Industry | Oil and Gas - Drilling |
| Sector | Oils-Energy |
| Fiscal Year End | December |
| Last Reported Quarter | 6/30/2024 |
| Exp Earnings Date | 11/4/2024 |
EPS Information
| Current Quarter EPS Consensus Estimate | -0.04 |
| Current Year EPS Consensus Estimate | -0.18 |
| Estimated Long-Term EPS Growth Rate | 32.60 |
| Exp Earnings Date | 11/4/2024 |
Price and Volume Information
| Zacks Rank | |
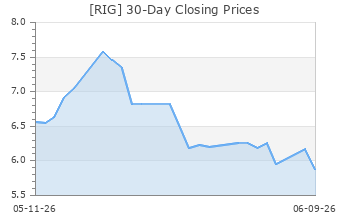
| Yesterday's Close | 4.54 |
| 52 Week High | 8.71 |
| 52 Week Low | 3.85 |
| Beta | 2.80 |
| 20 Day Moving Average | 21,293,656.00 |
| Target Price Consensus | 7.02 |
| 4 Week | -8.65 |
| 12 Week | -15.14 |
| YTD | -28.50 |
| 4 Week | -9.74 |
| 12 Week | -18.74 |
| YTD | -40.31 |
| Shares Outstanding (millions) | 875.47 |
| Market Capitalization (millions) | 3,974.64 |
| Short Ratio | NA |
| Last Split Date | 11/27/2007 |
| Dividend Yield | 0.00% |
| Annual Dividend | $0.00 |
| Payout Ratio | NA |
| Change in Payout Ratio | NA |
| Last Dividend Payout / Amount | NA / $0.00 |
Fundamental Ratios
| P/E (F1) | NA |
| Trailing 12 Months | NA |
| PEG Ratio | NA |
| vs. Previous Year | 0.00% |
| vs. Previous Quarter | -400.00% |
| vs. Previous Year | 18.11% |
| vs. Previous Quarter | 12.84% |
| Price/Book | 0.37 |
| Price/Cash Flow | 34.01 |
| Price / Sales | 1.29 |
| 6/30/24 | -4.76 |
| 3/31/24 | -4.67 |
| 12/31/23 | -7.13 |
| 6/30/24 | -2.48 |
| 3/31/24 | -2.42 |
| 12/31/23 | -3.66 |
| 6/30/24 | 1.36 |
| 3/31/24 | 1.35 |
| 12/31/23 | 1.52 |
| 6/30/24 | 1.08 |
| 3/31/24 | 1.04 |
| 12/31/23 | 1.22 |
| 6/30/24 | -16.21 |
| 3/31/24 | -16.50 |
| 12/31/23 | -26.09 |
| 6/30/24 | -11.34 |
| 3/31/24 | -13.27 |
| 12/31/23 | -33.69 |
| 6/30/24 | -13.19 |
| 3/31/24 | -21.05 |
| 12/31/23 | -33.23 |
| 6/30/24 | 12.23 |
| 3/31/24 | 12.84 |
| 12/31/23 | 12.88 |
| 6/30/24 | 5.02 |
| 3/31/24 | 5.03 |
| 12/31/23 | 4.89 |
| 6/30/24 | 0.63 |
| 3/31/24 | 0.65 |
| 12/31/23 | 0.68 |
| 6/30/24 | 38.75 |
| 3/31/24 | 39.26 |
| 12/31/23 | 40.34 |