S&P Global (SPGI)
(Delayed Data from NYSE)
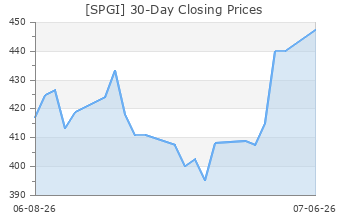
$523.67 USD
-0.55 (-0.10%)
Updated Sep 20, 2024 04:00 PM ET
After-Market: $523.67 0.00 (0.00%) 7:58 PM ET
3-Hold of 5 3
D Value C Growth F Momentum D VGM
Company Summary
Incorporated in December 1925, S&P Global Inc. is a leading provider of transparent and independent ratings, benchmarks, analytics and data to the capital and commodity markets worldwide.
The company operates through six reportable segments: S&P Global Market Intelligence (“Market Intelligence”), S&P Global Ratings (“Ratings"), S&P Global Commodity Insights (“Commodity Insights”), S&P Global Mobility (“Mobility”), S&P Dow Jones Indices (“Indices”) and S&P Global Engineering Solutions (“Engineering Solutions”).
Ratings (27% of total revenues in 2023): ...
Company Summary
The company operates through six reportable segments: S&P Global Market Intelligence (“Market Intelligence”), S&P Global Ratings (“Ratings"), S&P Global Commodity Insights (“Commodity Insights”), S&P Global Mobility (“Mobility”), S&P Dow Jones Indices (“Indices”) and S&P Global Engineering Solutions (“Engineering Solutions”).
Ratings (27% of total revenues in 2023): Ratings operates as an independent provider of credit ratings, research and analytics, providing investors and other market participants with information, ratings and benchmarks. With offices in more than 25 countries globally, Ratings holds an important position in the world's financial infrastructure. Ratings’ revenues are differentiated between transaction and non-transaction revenues.
Market Intelligence (34%): It helps investment professionals, government agencies, corporations and universities to track performance, generate alpha, identify investment ideas, understand competitive and industry dynamics, perform evaluations and assess credit risk. Desktop, Data Management Solutions and Risk Services are the business lines included in the segment.
Commodity Insights (15%): Commodity Insights provides information and benchmark prices for commodity and energy markets. It helps producers, traders, energy and commodity market intermediaries with price data, analytics and industry insights, thereby enhancing transparency and efficiency in the market.
Indices (11%): Indices is a global index provider that maintains a wide variety of valuation and index benchmarks for investment advisors, wealth managers and institutional investors. Indices mainly derives revenues from asset-linked fees based on the S&P and Dow Jones indices and also from subscription and transaction revenues.
Mobility (12%) & Engineering Solutions (1%) which were acquired as a result of the IHS Markit buyout, serves two different sections of customers. Mobility serves vehicle manufacturers, automotive suppliers, mobility service providers, retailers, consumers, and finance and insurance companies while Engineering Solutions serves technical professionals.
General Information
S&P Global Inc
55 WATER STREET
NEW YORK, NY 10041
Phone: 212-438-1000
Fax: 212-512-3840
Email: investor.relations@spglobal.com
| Industry | Business - Information Services |
| Sector | Business Services |
| Fiscal Year End | December |
| Last Reported Quarter | 6/30/2024 |
| Exp Earnings Date | 11/7/2024 |
EPS Information
| Current Quarter EPS Consensus Estimate | 3.38 |
| Current Year EPS Consensus Estimate | 14.57 |
| Estimated Long-Term EPS Growth Rate | 12.30 |
| Exp Earnings Date | 11/7/2024 |
Price and Volume Information
| Zacks Rank | |
| Yesterday's Close | 524.22 |
| 52 Week High | 528.02 |
| 52 Week Low | 340.49 |
| Beta | 1.17 |
| 20 Day Moving Average | 978,302.12 |
| Target Price Consensus | 556.19 |
| 4 Week | 5.11 |
| 12 Week | 16.78 |
| YTD | 19.00 |
| 4 Week | 2.48 |
| 12 Week | 12.06 |
| YTD | -0.66 |
| Shares Outstanding (millions) | 313.00 |
| Market Capitalization (millions) | 164,080.84 |
| Short Ratio | NA |
| Last Split Date | 5/18/2005 |
| Dividend Yield | 0.69% |
| Annual Dividend | $3.64 |
| Payout Ratio | 0.25 |
| Change in Payout Ratio | -0.01 |
| Last Dividend Payout / Amount | 8/27/2024 / $0.91 |
Fundamental Ratios
| P/E (F1) | 35.99 |
| Trailing 12 Months | 36.43 |
| PEG Ratio | 2.93 |
| vs. Previous Year | 29.49% |
| vs. Previous Quarter | 0.75% |
| vs. Previous Year | 14.45% |
| vs. Previous Quarter | 1.66% |
| Price/Book | 4.69 |
| Price/Cash Flow | 31.90 |
| Price / Sales | 12.36 |
| 6/30/24 | 13.03 |
| 3/31/24 | 12.20 |
| 12/31/23 | 11.34 |
| 6/30/24 | 7.48 |
| 3/31/24 | 7.04 |
| 12/31/23 | 6.59 |
| 6/30/24 | 1.03 |
| 3/31/24 | 0.92 |
| 12/31/23 | 0.84 |
| 6/30/24 | 1.03 |
| 3/31/24 | 0.92 |
| 12/31/23 | 0.84 |
| 6/30/24 | 34.17 |
| 3/31/24 | 33.25 |
| 12/31/23 | 32.17 |
| 6/30/24 | 25.03 |
| 3/31/24 | 22.01 |
| 12/31/23 | 21.02 |
| 6/30/24 | 33.77 |
| 3/31/24 | 30.71 |
| 12/31/23 | 29.38 |
| 6/30/24 | 111.72 |
| 3/31/24 | 110.02 |
| 12/31/23 | 109.20 |
| 6/30/24 | NA |
| 3/31/24 | NA |
| 12/31/23 | NA |
| 6/30/24 | 0.33 |
| 3/31/24 | 0.33 |
| 12/31/23 | 0.33 |
| 6/30/24 | 30.59 |
| 3/31/24 | 30.67 |
| 12/31/23 | 30.72 |