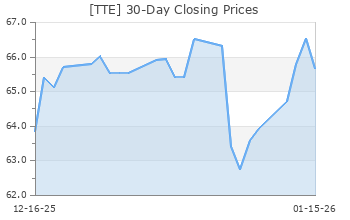
TotalEnergies (TTE)
(Delayed Data from NYSE)
$59.67 USD
+0.37 (0.62%)
Updated May 26, 2023 04:00 PM ET
After-Market: $59.68 +0.01 (0.02%) 7:58 PM ET
3-Hold of 5 3
A Value B Growth A Momentum A VGM
Company Summary
France-based TotalEnergies SE is among the top five publicly traded global integrated oil and gas companies based on production volumes, proved reserves and market capitalization. The company has operations in more than 130 countries across five continents. The company was founded in 1924. The company has changed its name from TOTAL SE to TotalEnergies SE, which better reflects its transition toward a broad energy company. The new trading symbol of the company is TTE.
The company’s operations are divided into four main segments: Exploration & Production; Integrated Gas, Renewables & Power, which spearheads TotalEnergies&...
Company Summary
France-based TotalEnergies SE is among the top five publicly traded global integrated oil and gas companies based on production volumes, proved reserves and market capitalization. The company has operations in more than 130 countries across five continents. The company was founded in 1924. The company has changed its name from TOTAL SE to TotalEnergies SE, which better reflects its transition toward a broad energy company. The new trading symbol of the company is TTE.
The company’s operations are divided into four main segments: Exploration & Production; Integrated Gas, Renewables & Power, which spearheads TotalEnergies’ ambitions in low-carbon businesses by expanding in downstream gas and renewable energies as well as in energy efficiency businesses; Refining and Chemicals, which includes all of its bioenergies activities and a new Biofuels division and Marketing & Services, which deals with the supply and sale of petroleum products. The company also has interests in coal mining and power generation.
Exploration & Production, Integrated Gas, Renewables & Power, Refining and Chemicals, along with Marketing & Services segments contributed 45.4%, 31.6%, 19%, and 4%, respectively, to net operating income for 2022. TTE will split its Integrated Gas, Renewables & Power into two new segments, Integrated LNG and Integrated Power.
The Exploration & Production segment includes the exploration, development and production of hydrocarbons as well as the production of natural gas and liquefied natural gas (LNG). The company is also committed to developing renewable energies as part of its upstream activities.
At present, the company has more than 11 years of proved reserves. Out of the proved reserves, 60% is gas and 40% is oil.
TotalEnergies’ profile will be transformed over the 2020-2030 time period. The company will now focus on increasing energy production from LNG and Renewable and Electricity and installed nearly 17 gigawatts (GW) of gross renewable capacity in 2022. Contribution from oil products is expected to decline to 30% of sales from 55% in the said time frame.
General Information
TotalEnergies SE Sponsored ADR
2 PLACE JEAN MILLIER LA DEFENSE 6
PARIS, I0 92400
Phone: 33-01-47-44-45-46
Fax: 33-01-47-44-49-44
Web: http://www.totalenergies.com
Email: ir@totalenergies.com
Industry | Oil and Gas - Refining and Marketing |
Sector | Oils-Energy |
Fiscal Year End | December |
Last Reported Quarter | 3/31/2023 |
Exp Earnings Date | 7/27/2023 |
EPS Information
Current Quarter EPS Consensus Estimate | 2.57 |
Current Year EPS Consensus Estimate | 11.17 |
Estimated Long-Term EPS Growth Rate | 9.30 |
Exp Earnings Date | 7/27/2023 |
Price and Volume Information
Zacks Rank | ![]() |
Yesterday's Close | 59.30 |
52 Week High | 65.05 |
52 Week Low | 44.61 |
Beta | 0.79 |
20 Day Moving Average | 1,154,065.25 |
Target Price Consensus | 70.80 |
4 Week | -6.66 |
12 Week | -4.92 |
YTD | -3.88 |
4 Week | -7.46 |
12 Week | -8.54 |
YTD | -12.25 |
Shares Outstanding (millions) | 2,481.94 |
Market Capitalization (millions) | 148,097.56 |
Short Ratio | NA |
Last Split Date | NA |
Dividend Yield | 3.69% |
Annual Dividend | $2.20 |
Payout Ratio | 0.17 |
Change in Payout Ratio | -0.41 |
Last Dividend Payout / Amount | 3/20/2023 / $0.55 |
Fundamental Ratios
P/E (F1) | 5.34 |
Trailing 12 Months | 4.53 |
PEG Ratio | 0.57 |
vs. Previous Year | -23.24% |
vs. Previous Quarter | -12.12% |
vs. Previous Year | -8.75% |
vs. Previous Quarter | -2.01% |
Price/Book | 1.25 |
Price/Cash Flow | 2.97 |
Price / Sales | 0.55 |
3/31/23 | 28.51 |
12/31/22 | 30.48 |
9/30/22 | 29.83 |
3/31/23 | 10.55 |
12/31/22 | 11.04 |
9/30/22 | 10.90 |
3/31/23 | 1.14 |
12/31/22 | 1.15 |
9/30/22 | 1.18 |
3/31/23 | 0.91 |
12/31/22 | 0.94 |
9/30/22 | 1.02 |
3/31/23 | 12.49 |
12/31/22 | 13.10 |
9/30/22 | 13.25 |
3/31/23 | 7.82 |
12/31/22 | 7.47 |
9/30/22 | 8.67 |
3/31/23 | 16.08 |
12/31/22 | 16.44 |
9/30/22 | 16.06 |
3/31/23 | 47.72 |
12/31/22 | 46.16 |
9/30/22 | 46.29 |
3/31/23 | 6.74 |
12/31/22 | 6.75 |
9/30/22 | 6.82 |
3/31/23 | 0.36 |
12/31/22 | 0.40 |
9/30/22 | 0.37 |
3/31/23 | 26.60 |
12/31/22 | 28.32 |
9/30/22 | 27.12 |