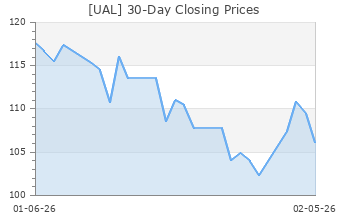
United Airlines (UAL)
(Delayed Data from NSDQ)
$52.36 USD
+0.19 (0.36%)
Updated Sep 23, 2024 04:00 PM ET
After-Market: $52.45 +0.09 (0.17%) 7:58 PM ET
3-Hold of 5 3
A Value B Growth C Momentum A VGM
Company Summary
United Airlines Holdings is based in Chicago. The carrier changed its name from United Continental Holdings to United Airlines Holdings in June 2019. It is the holding company for both United Airlines and Continental Airlines.
United Airlines, whose fiscal year coincides with the calendar year, transports people and cargo not only throughout North America but also destinations in Asia, Europe, the Middle East and Latin America. The carrier's hubs are at Newark Liberty International Airport, Chicago O’Hare International Airport , Denver International Airport , George Bush Intercontinental Airport, Los Angeles International Airport , A.B. ...
Company Summary
United Airlines Holdings is based in Chicago. The carrier changed its name from United Continental Holdings to United Airlines Holdings in June 2019. It is the holding company for both United Airlines and Continental Airlines.
United Airlines, whose fiscal year coincides with the calendar year, transports people and cargo not only throughout North America but also destinations in Asia, Europe, the Middle East and Latin America. The carrier's hubs are at Newark Liberty International Airport, Chicago O’Hare International Airport , Denver International Airport , George Bush Intercontinental Airport, Los Angeles International Airport , A.B. Won Pat International Airport, San Francisco International Airport and Washington Dulles International Airport.
Passenger revenues account for the bulk of its top line. Notably, due to the removal of coronavirus-related woes, passenger revenues increased 22.5% year over year in 2023 to $49.04 billion. Owing to the brightening scenario, passenger revenues accounted for the bulk (92%) of the top line in 2023. Cargo revenues contributed 2.8% while the rest came from other sources. Cargo revenues declined 31.1% from 2022 levels due to lower yields as a result of higher market capacity
Domestic revenues (United States and Canada) accounted for 60.4% of the total revenues in 2023. Atlantic, Pacific and Latin American regions accounted for 20.4%, 9.8% and 9.4% respectively in 2023.
As of Dec 31, 2023 the carrier's total fleet size stood at 1,358, out of which 945 (out of which 812 were owned and 133 leased) were mainline and 413 (128 owned and 285 either owned or leased by regional carriers) regional. United Airlines is a member of Star Alliance, the largest and most comprehensive airline alliance in the world.
United Airlines is part of four passenger joint business arrangements ("JBAs"). Moreover, the company's MileagePlus loyalty program is aimed at promoting customer loyalty by offering awards, benefits and services to its members.
Participants in the program are eligible to earn miles for flights on United Airlines, United Express, Star Alliance members and certain other airlines. In 2023, roughly 7.4 million MileagePlus flight awards were used on United and United Express. Notably, MileagePlus flight awards represented 8.1% of the company's total revenue passenger miles.
General Information
United Airlines Holdings Inc
233 SOUTH WACKER DRIVE
CHICAGO, IL 60606
Phone: 872-825-4000
Fax: 847-700-2214
Email: investorrelations@united.com
| Industry | Transportation - Airline |
| Sector | Transportation |
| Fiscal Year End | December |
| Last Reported Quarter | 6/30/2024 |
| Exp Earnings Date | 10/15/2024 |
EPS Information
| Current Quarter EPS Consensus Estimate | 3.05 |
| Current Year EPS Consensus Estimate | 9.74 |
| Estimated Long-Term EPS Growth Rate | 4.90 |
| Exp Earnings Date | 10/15/2024 |
Price and Volume Information
| Zacks Rank | |
| Yesterday's Close | 52.17 |
| 52 Week High | 56.18 |
| 52 Week Low | 33.68 |
| Beta | 1.43 |
| 20 Day Moving Average | 6,525,163.00 |
| Target Price Consensus | 69.03 |

| 4 Week | 20.43 |
| 12 Week | 7.21 |
| YTD | 26.44 |
| 4 Week | 19.00 |
| 12 Week | 2.66 |
| YTD | 5.76 |
| Shares Outstanding (millions) | 328.83 |
| Market Capitalization (millions) | 17,155.27 |
| Short Ratio | NA |
| Last Split Date | NA |
| Dividend Yield | 0.00% |
| Annual Dividend | $0.00 |
| Payout Ratio | 0.00 |
| Change in Payout Ratio | 0.00 |
| Last Dividend Payout / Amount | NA / $0.00 |
Fundamental Ratios
| P/E (F1) | 5.36 |
| Trailing 12 Months | 5.41 |
| PEG Ratio | 1.09 |
| vs. Previous Year | -17.69% |
| vs. Previous Quarter | 2,860.00% |
| vs. Previous Year | 5.70% |
| vs. Previous Quarter | 19.52% |
| Price/Book | 1.63 |
| Price/Cash Flow | 2.78 |
| Price / Sales | 0.31 |
| 6/30/24 | 33.90 |
| 3/31/24 | 39.85 |
| 12/31/23 | 41.01 |
| 6/30/24 | 4.44 |
| 3/31/24 | 4.83 |
| 12/31/23 | 4.63 |
| 6/30/24 | 0.77 |
| 3/31/24 | 0.75 |
| 12/31/23 | 0.83 |
| 6/30/24 | 0.71 |
| 3/31/24 | 0.69 |
| 12/31/23 | 0.76 |
| 6/30/24 | 5.77 |
| 3/31/24 | 6.37 |
| 12/31/23 | 6.21 |
| 6/30/24 | 5.28 |
| 3/31/24 | 4.90 |
| 12/31/23 | 4.87 |
| 6/30/24 | 6.89 |
| 3/31/24 | 6.35 |
| 12/31/23 | 6.31 |
| 6/30/24 | 32.01 |
| 3/31/24 | 27.94 |
| 12/31/23 | 28.42 |
| 6/30/24 | 11.18 |
| 3/31/24 | 11.66 |
| 12/31/23 | 12.80 |
| 6/30/24 | 2.07 |
| 3/31/24 | 2.52 |
| 12/31/23 | 2.70 |
| 6/30/24 | 67.39 |
| 3/31/24 | 71.58 |
| 12/31/23 | 72.95 |

