We use cookies to understand how you use our site and to improve your experience.
This includes personalizing content and advertising.
By pressing "Accept All" or closing out of this banner, you consent to the use of all cookies and similar technologies and the sharing of information they collect with third parties.
You can reject marketing cookies by pressing "Deny Optional," but we still use essential, performance, and functional cookies.
In addition, whether you "Accept All," Deny Optional," click the X or otherwise continue to use the site, you accept our Privacy Policy and Terms of Service, revised from time to time.
You are being directed to ZacksTrade, a division of LBMZ Securities and licensed broker-dealer. ZacksTrade and Zacks.com are separate companies. The web link between the two companies is not a solicitation or offer to invest in a particular security or type of security. ZacksTrade does not endorse or adopt any particular investment strategy, any analyst opinion/rating/report or any approach to evaluating individual securities.
If you wish to go to ZacksTrade, click OK. If you do not, click Cancel.
Dividend stocks are strong choice for investors looking for both growth and consistent income.
Long-term investors need to beware of stocks with high-dividend yields, yet poor financial fundamentals.
Some high-ranking dividend stocks for reliable income include Seanergy, Open Text and Euroseas.
Dividend stocks share a slice of profits with investors, delivering steady cash that can help meet liquidity needs and temper portfolio swings when markets are choppy. Over time, reinvested payouts have been a major driver of total return—quietly compounding even when prices stall.
Picking the right payers is the hard part. A high yield alone can be a warning sign; “dividend traps” often pair eye-catching payouts with weak balance sheets or eroding cash flows that invite cuts. The better approach is to focus on durability: moderate payout ratios, consistent free cash generation, prudent leverage, and a record of maintaining or raising dividends.
With that framework, we highlight dividend stocks that combine sustainable income with reasonable entry point. The goal is simple: reliable, repeatable income from businesses built to keep paying through the cycle.
This is our short term rating system that serves as a timeliness indicator for stocks over the next 1 to 3 months. How good is it? See rankings and related performance below.
The Zacks Industry Rank assigns a rating to each of the 265 X (Expanded) Industries based on their average Zacks Rank.
An industry with a larger percentage of Zacks Rank #1's and #2's will have a better average Zacks Rank than one with a larger percentage of Zacks Rank #4's and #5's.
The industry with the best average Zacks Rank would be considered the top industry (1 out of 265), which would place it in the top 1% of Zacks Ranked Industries. The industry with the worst average Zacks Rank (265 out of 265) would place in the bottom 1%.
The Zacks Sector Rank assigns a rating to each of the 16 Sectors based on their average Zacks Rank.
A sector with a larger percentage of Zacks Rank #1's and #2's will have a better average Zacks Rank than one with a larger percentage of Zacks Rank #4's and #5's.
The sector with the best average Zacks Rank would be considered the top sector (1 out of 16), which would place it in the top 1% of Zacks Ranked Sectors. The sector with the worst average Zacks Rank (16 out of 16) would place in the bottom 1%.
The Style Scores are a complementary set of indicators to use alongside the Zacks Rank. It allows the user to better focus on the stocks that are the best fit for his or her personal trading style.
The scores are based on the trading styles of Value, Growth, and Momentum. There's also a VGM Score ('V' for Value, 'G' for Growth and 'M' for Momentum), which combines the weighted average of the individual style scores into one score.
Value ScoreA
Growth ScoreA
Momentum ScoreA
VGM ScoreA
Within each Score, stocks are graded into five groups: A, B, C, D and F. As you might remember from your school days, an A, is better than a B; a B is better than a C; a C is better than a D; and a D is better than an F.
As an investor, you want to buy stocks with the highest probability of success. That means you want to buy stocks with a Zacks Rank #1 or #2, Strong Buy or Buy, which also has a Score of an A or a B in your personal trading style.
Zacks Earnings ESP (Expected Surprise Prediction) looks to find companies that have recently seen positive earnings estimate revision activity. The idea is that more recent information is, generally speaking, more accurate and can be a better predictor of the future, which can give investors an advantage in earnings season.
The technique has proven to be very useful for finding positive surprises. In fact, when combining a Zacks Rank #3 or better and a positive Earnings ESP, stocks produced a positive surprise 70% of the time, while they also saw 28.3% annual returns on average, according to our 10 year backtest.
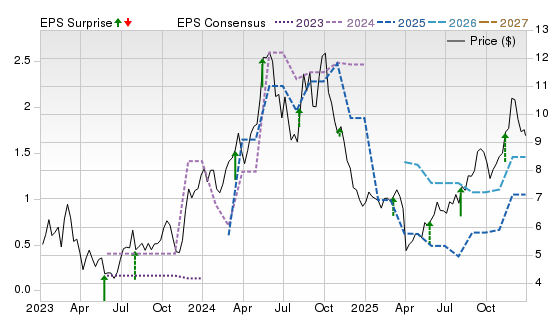
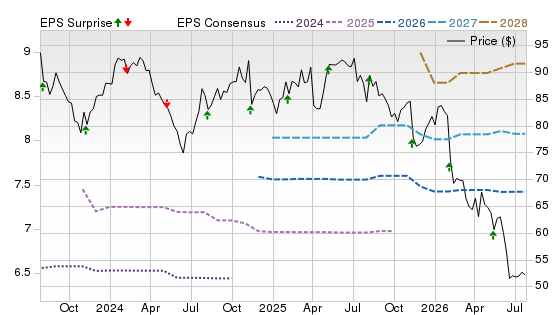
Seanergy Maritime operates Capesize and Newcastlemax dry-bulk vessels. Second-quarter 2026 revenue and TCE rates rose sharply year over year, and 71% of third-quarter days were fixed near $31,000. Charters for three 2027 newbuildings add cash-breakeven floors with index-linked upside. A 4.97% yield and stable payout ratio support dividend flexibility, though distributions remain cyclical.
Potential Risks
Capesize earnings remain exposed to Chinese steel demand, iron-ore flows and freight-rate volatility. The renewal program and new bond financing also increase execution and balance-sheet risk.
Forecast
A Zacks Rank #3 (Hold) implies a neutral near-term setup; Style Scores of Value A and B for Growth and Momentum suggest attractive cash-flow pricing despite cyclicality. The Price, Consensus & EPS Surprise chart shows consensus EPS recovering from 2026 lows and rising into 2028, but with wide revisions. Mostly positive surprises help, though the steep recent price decline signals skepticism.
This is our short term rating system that serves as a timeliness indicator for stocks over the next 1 to 3 months. How good is it? See rankings and related performance below.
The Zacks Industry Rank assigns a rating to each of the 265 X (Expanded) Industries based on their average Zacks Rank.
An industry with a larger percentage of Zacks Rank #1's and #2's will have a better average Zacks Rank than one with a larger percentage of Zacks Rank #4's and #5's.
The industry with the best average Zacks Rank would be considered the top industry (1 out of 265), which would place it in the top 1% of Zacks Ranked Industries. The industry with the worst average Zacks Rank (265 out of 265) would place in the bottom 1%.
The Zacks Sector Rank assigns a rating to each of the 16 Sectors based on their average Zacks Rank.
A sector with a larger percentage of Zacks Rank #1's and #2's will have a better average Zacks Rank than one with a larger percentage of Zacks Rank #4's and #5's.
The sector with the best average Zacks Rank would be considered the top sector (1 out of 16), which would place it in the top 1% of Zacks Ranked Sectors. The sector with the worst average Zacks Rank (16 out of 16) would place in the bottom 1%.
The Style Scores are a complementary set of indicators to use alongside the Zacks Rank. It allows the user to better focus on the stocks that are the best fit for his or her personal trading style.
The scores are based on the trading styles of Value, Growth, and Momentum. There's also a VGM Score ('V' for Value, 'G' for Growth and 'M' for Momentum), which combines the weighted average of the individual style scores into one score.
Value ScoreA
Growth ScoreA
Momentum ScoreA
VGM ScoreA
Within each Score, stocks are graded into five groups: A, B, C, D and F. As you might remember from your school days, an A, is better than a B; a B is better than a C; a C is better than a D; and a D is better than an F.
As an investor, you want to buy stocks with the highest probability of success. That means you want to buy stocks with a Zacks Rank #1 or #2, Strong Buy or Buy, which also has a Score of an A or a B in your personal trading style.
Zacks Earnings ESP (Expected Surprise Prediction) looks to find companies that have recently seen positive earnings estimate revision activity. The idea is that more recent information is, generally speaking, more accurate and can be a better predictor of the future, which can give investors an advantage in earnings season.
The technique has proven to be very useful for finding positive surprises. In fact, when combining a Zacks Rank #3 or better and a positive Earnings ESP, stocks produced a positive surprise 70% of the time, while they also saw 28.3% annual returns on average, according to our 10 year backtest.
OpenText provides enterprise information-management, cybersecurity and cloud software. Fiscal third-quarter 2026 cloud revenue grew as total revenue returned to growth, reinforcing its shift toward recurring sales. Sovereign-cloud partnerships, agentic AI, and portfolio simplification could lift growth and margins. A low payout ratio supports the 4.25% yield while preserving capacity for debt reduction.
Potential Risks
Free cash flow declined year over year, so earnings gains must translate more into cash. Integration complexity, leadership transition and cautious enterprise technology spending could delay the reacceleration.
Forecast
A Zacks Rank #3 indicates a market-matching outlook. Value A highlights the low cash-flow multiple, but Growth C and Momentum D reflect subdued operating momentum. The chart shows consensus EPS stabilizing after earlier cuts, with 2027 and 2028 estimates positioned above 2026. Surprise markers are mixed, and a durable rerating likely requires stronger cloud expansion, steadier free cash flow and upward estimate revisions.
This is our short term rating system that serves as a timeliness indicator for stocks over the next 1 to 3 months. How good is it? See rankings and related performance below.
The Zacks Industry Rank assigns a rating to each of the 265 X (Expanded) Industries based on their average Zacks Rank.
An industry with a larger percentage of Zacks Rank #1's and #2's will have a better average Zacks Rank than one with a larger percentage of Zacks Rank #4's and #5's.
The industry with the best average Zacks Rank would be considered the top industry (1 out of 265), which would place it in the top 1% of Zacks Ranked Industries. The industry with the worst average Zacks Rank (265 out of 265) would place in the bottom 1%.
The Zacks Sector Rank assigns a rating to each of the 16 Sectors based on their average Zacks Rank.
A sector with a larger percentage of Zacks Rank #1's and #2's will have a better average Zacks Rank than one with a larger percentage of Zacks Rank #4's and #5's.
The sector with the best average Zacks Rank would be considered the top sector (1 out of 16), which would place it in the top 1% of Zacks Ranked Sectors. The sector with the worst average Zacks Rank (16 out of 16) would place in the bottom 1%.
The Style Scores are a complementary set of indicators to use alongside the Zacks Rank. It allows the user to better focus on the stocks that are the best fit for his or her personal trading style.
The scores are based on the trading styles of Value, Growth, and Momentum. There's also a VGM Score ('V' for Value, 'G' for Growth and 'M' for Momentum), which combines the weighted average of the individual style scores into one score.
Value ScoreA
Growth ScoreA
Momentum ScoreA
VGM ScoreA
Within each Score, stocks are graded into five groups: A, B, C, D and F. As you might remember from your school days, an A, is better than a B; a B is better than a C; a C is better than a D; and a D is better than an F.
As an investor, you want to buy stocks with the highest probability of success. That means you want to buy stocks with a Zacks Rank #1 or #2, Strong Buy or Buy, which also has a Score of an A or a B in your personal trading style.
Zacks Earnings ESP (Expected Surprise Prediction) looks to find companies that have recently seen positive earnings estimate revision activity. The idea is that more recent information is, generally speaking, more accurate and can be a better predictor of the future, which can give investors an advantage in earnings season.
The technique has proven to be very useful for finding positive surprises. In fact, when combining a Zacks Rank #3 or better and a positive Earnings ESP, stocks produced a positive surprise 70% of the time, while they also saw 28.3% annual returns on average, according to our 10 year backtest.
Euroseas owns feeder and intermediate containerships chartered to liner companies. First-quarter 2026 results showed firmer charter rates despite a smaller fleet, while contracted coverage supports cash-flow visibility. Fleet renewal could further improve efficiency and earnings quality. Its 4.21% yield is backed by a 17% payout ratio and modest leverage, supporting distributions through shipping-cycle volatility.
Potential Risks
Container markets remain cyclical, and global vessel deliveries could pressure charter rates if trade disruptions normalize. Newbuilding commitments add construction, financing and delivery risk.
Forecast
A Zacks Rank #3 signals a balanced outlook. Value A supports the inexpensive cash-flow valuation, whereas Growth D and Momentum C warn against extrapolating peak-cycle earnings. The chart shows estimates rebounding after volatility and 2028 EPS above 2026, though the path is uneven. Recent surprises lean positive, and the price uptrend suggests investors expect charter coverage to cushion normalization.
This is our short term rating system that serves as a timeliness indicator for stocks over the next 1 to 3 months. How good is it? See rankings and related performance below.
The Zacks Industry Rank assigns a rating to each of the 265 X (Expanded) Industries based on their average Zacks Rank.
An industry with a larger percentage of Zacks Rank #1's and #2's will have a better average Zacks Rank than one with a larger percentage of Zacks Rank #4's and #5's.
The industry with the best average Zacks Rank would be considered the top industry (1 out of 265), which would place it in the top 1% of Zacks Ranked Industries. The industry with the worst average Zacks Rank (265 out of 265) would place in the bottom 1%.
The Zacks Sector Rank assigns a rating to each of the 16 Sectors based on their average Zacks Rank.
A sector with a larger percentage of Zacks Rank #1's and #2's will have a better average Zacks Rank than one with a larger percentage of Zacks Rank #4's and #5's.
The sector with the best average Zacks Rank would be considered the top sector (1 out of 16), which would place it in the top 1% of Zacks Ranked Sectors. The sector with the worst average Zacks Rank (16 out of 16) would place in the bottom 1%.
The Style Scores are a complementary set of indicators to use alongside the Zacks Rank. It allows the user to better focus on the stocks that are the best fit for his or her personal trading style.
The scores are based on the trading styles of Value, Growth, and Momentum. There's also a VGM Score ('V' for Value, 'G' for Growth and 'M' for Momentum), which combines the weighted average of the individual style scores into one score.
Value ScoreA
Growth ScoreA
Momentum ScoreA
VGM ScoreA
Within each Score, stocks are graded into five groups: A, B, C, D and F. As you might remember from your school days, an A, is better than a B; a B is better than a C; a C is better than a D; and a D is better than an F.
As an investor, you want to buy stocks with the highest probability of success. That means you want to buy stocks with a Zacks Rank #1 or #2, Strong Buy or Buy, which also has a Score of an A or a B in your personal trading style.
Zacks Earnings ESP (Expected Surprise Prediction) looks to find companies that have recently seen positive earnings estimate revision activity. The idea is that more recent information is, generally speaking, more accurate and can be a better predictor of the future, which can give investors an advantage in earnings season.
The technique has proven to be very useful for finding positive surprises. In fact, when combining a Zacks Rank #3 or better and a positive Earnings ESP, stocks produced a positive surprise 70% of the time, while they also saw 28.3% annual returns on average, according to our 10 year backtest.
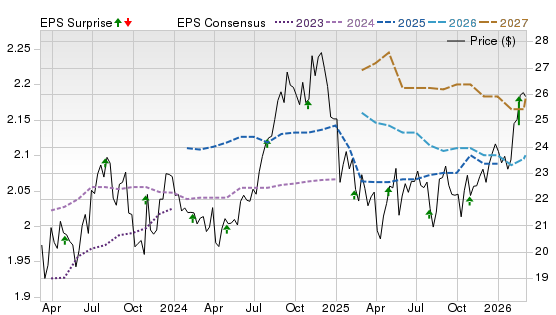
Kite Realty owns grocery-anchored shopping centers and mixed-use properties. Second-quarter 2026 same-property NOI growth, strong leasing and capital recycling support further cash-flow gains as signed leases commence. Grocery exposure and improving portfolio quality add resilience. The 4.02% yield, supported by a manageable payout ratio, offers attractive income with room for measured dividend growth.
Potential Risks
Higher interest rates could raise refinancing costs and compress REIT valuations. Retail bankruptcies, weaker consumer spending, delayed tenant openings, or poor reinvestment of disposition proceeds could slow NOI growth.
Forecast
A Zacks Rank #3 suggests a neutral setup. Momentum A reflects strong price action, while Value C and Growth F temper expectations. The chart shows consensus EPS moving higher into 2027 and 2028 after a choppy 2026 base. Positive surprise markers are supportive, but the sharp rally has outpaced near-term estimates, leaving shares sensitive to rate changes or softer leasing data.
This is our short term rating system that serves as a timeliness indicator for stocks over the next 1 to 3 months. How good is it? See rankings and related performance below.
The Zacks Industry Rank assigns a rating to each of the 265 X (Expanded) Industries based on their average Zacks Rank.
An industry with a larger percentage of Zacks Rank #1's and #2's will have a better average Zacks Rank than one with a larger percentage of Zacks Rank #4's and #5's.
The industry with the best average Zacks Rank would be considered the top industry (1 out of 265), which would place it in the top 1% of Zacks Ranked Industries. The industry with the worst average Zacks Rank (265 out of 265) would place in the bottom 1%.
The Zacks Sector Rank assigns a rating to each of the 16 Sectors based on their average Zacks Rank.
A sector with a larger percentage of Zacks Rank #1's and #2's will have a better average Zacks Rank than one with a larger percentage of Zacks Rank #4's and #5's.
The sector with the best average Zacks Rank would be considered the top sector (1 out of 16), which would place it in the top 1% of Zacks Ranked Sectors. The sector with the worst average Zacks Rank (16 out of 16) would place in the bottom 1%.
The Style Scores are a complementary set of indicators to use alongside the Zacks Rank. It allows the user to better focus on the stocks that are the best fit for his or her personal trading style.
The scores are based on the trading styles of Value, Growth, and Momentum. There's also a VGM Score ('V' for Value, 'G' for Growth and 'M' for Momentum), which combines the weighted average of the individual style scores into one score.
Value ScoreA
Growth ScoreA
Momentum ScoreA
VGM ScoreA
Within each Score, stocks are graded into five groups: A, B, C, D and F. As you might remember from your school days, an A, is better than a B; a B is better than a C; a C is better than a D; and a D is better than an F.
As an investor, you want to buy stocks with the highest probability of success. That means you want to buy stocks with a Zacks Rank #1 or #2, Strong Buy or Buy, which also has a Score of an A or a B in your personal trading style.
Zacks Earnings ESP (Expected Surprise Prediction) looks to find companies that have recently seen positive earnings estimate revision activity. The idea is that more recent information is, generally speaking, more accurate and can be a better predictor of the future, which can give investors an advantage in earnings season.
The technique has proven to be very useful for finding positive surprises. In fact, when combining a Zacks Rank #3 or better and a positive Earnings ESP, stocks produced a positive surprise 70% of the time, while they also saw 28.3% annual returns on average, according to our 10 year backtest.
Amdocs provides software and managed services to telecom and media companies. Fiscal second-quarter 2026 revenue and backlog grew, while management maintained its free-cash-flow outlook. Cloud modernization, network automation and AI adoption could support steadier growth and productivity gains. Its 4.01% yield is supported by a manageable payout ratio, low leverage and consistent cash generation.
Potential Risks
Customer concentration, restructuring costs, currency movements, leadership transition and slower conversion of backlog into revenue could restrain margins and estimates.
Forecast
A Zacks Rank #2 (Buy) signals above-average potential, reinforced by Value A. However, Growth D and Momentum F indicate limited acceleration and weak price behavior. The chart shows 2026-2028 EPS consensus trending higher overall, despite some near-term estimate volatility. A generally positive surprise pattern supports confidence in execution, while further upside depends on backlog conversion, stronger organic growth and measurable returns from AI-led offerings.
The Zacks Rank is a proprietary stock-rating model that uses trends in earnings estimate revisions and earnings-per-share (EPS) surprises to classify stocks into five groups: #1 (Strong Buy), #2 (Buy), #3 (Hold), #4 (Sell) and #5 (Strong Sell). The Zacks Rank is calculated through four primary factors related to earnings estimates: analysts' consensus on earnings estimate revisions, the magnitude of revision change, the upside potential and estimate surprise (or the degree in which earnings per share deviated from the previous quarter).
Zacks builds the data from 3,000 analysts at over 150 different brokerage firms. The average yearly gain for Zacks Rank #1 (Strong Buy) stocks is +23.94% per year from January 1, 1988, through July 6, 2026.
Zacks' 7 Best Strong Buy Stocks (New Research Report)
Valued at $99, click below to receive our just-released report predicting the 7 stocks that will soar highest in the coming month.
For this list, only companies trading on the New York Stock Exchange or NASDAQ with a dividend yield of 4% or higher were included. We also only evaluated stock with a low debt-to-equity ratio, as well as a conservative payout ratio and dividend growth. Only stocks with a Zacks Rank #3 (Hold) or higher were considered. All information is current as of market open, July 30, 2026.
Guide to Best Dividend Stocks
What Are Dividend Stocks?
Dividend stocks are shares of companies that return a portion of their earnings to shareholders on a regular basis. Rather than relying solely on stock price appreciation, dividend investors benefit from this income stream, which can complement long-term growth.
How Do Dividend Stocks Work?
Corporations that generate surplus cash may decide to share part of it with shareholders through dividends. The firm’s board will declare a dividend — often expressed as a dollar amount per share — and set a record date to identify eligible shareholders. On the payment date, the company sends the dividend (in cash or additional shares) to investors who held the stock on the record date.
Dividends typically come out of a company’s profits or free cash flow. To continue paying dividends, companies need consistent earnings, prudent capital allocation, and manageable debt levels.
How Often Do Dividend Stocks Pay in a Year?
Most U.S. dividend-paying companies distribute dividends quarterly (four times per year). Some firms choose semiannual or annual payments, depending on business norms or cash flow timing. What matters more than the frequency is consistency — companies that maintain or increase their dividend over time tend to instill more investor confidence.
Supplemental income stream — Dividends provide cash flow even if the stock price is flat or in decline.
Total return boost — Over long horizons, dividends have historically contributed a meaningful share of returns. (Many capital markets analyses show dividends often account for 30–50% of total equity returns.)
Downside cushion — In volatile markets, dividend income helps offset capital losses.
Sign of stability — Companies that consistently pay or increase dividends often have disciplined management and stable cash flows.
Risks:
Dividend cuts — If a company hits a rough patch, it might reduce or suspend dividends, which often leads to share price declines.
Limited growth reinvestment — High dividend payments may reduce funds available for expansion or innovation.
Interest rate competition — When bond yields rise, dividend stocks (especially those with modest growth prospects) may look less attractive in comparison.
Tax drag — Dividends are taxed (depending on account structure and holding period), which can eat into net return.
Dividend Stock ETFs vs Individual Stocks
When considering dividend exposure, investors have two main paths:
Individual dividend stocks: You pick specific companies you trust to pay and grow dividends. This gives you direct control over stocks and allows targeted allocation to sectors or themes you favor.
Dividend ETFs / mutual funds: Pools of dividend-paying stocks maintained by professional managers. These provide instant diversification, reduce individual stock risk, and simplify portfolio management.
Pros of Dividend ETFs
Automatic diversification lowers the risk of a single holding failing.
Fund managers monitor holdings and rebalance.
Easier to scale and maintain, especially for smaller portfolios.
Cons of Dividend ETFs vs Individual Stocks
Yields tend to be diluted by including lower-yielding names.
Less control over specific holdings or sector weightings.
Management fees may erode yields over time.
Many investors use a hybrid strategy: core allocation via a dividend ETF (for stability) supplemented by hand-picked individual dividend stocks for yield or growth.
How to Choose the Best Dividend Stocks
Not all dividend stocks are created equal. Here’s what to look for when evaluating candidates:
Dividend Yield
Yield = (Annual Dividend per Share) ÷ (Current Share Price). A moderate, well-supported yield (say 2 %–6 %, depending on sector) can be healthy, while extremely high yields often signal trouble (e.g. deep decline in share price)
Dividend Payout Ratio
This ratio shows what percentage of a company’s earnings are paid out as dividends. If a company distributes too much (e.g. > 80–90 %), it may lack flexibility to weather downturns. More conservative ratios (e.g. 30–60 %) often indicate room for future increases or a buffer in tough times.
Dividend Growth History
Look for firms that have steadily raised their dividends over years. A consistent upward trend signals confidence in future earnings. Dividend “Aristocrats” — firms in the S&P 500 that have raised dividends for at least 25 consecutive years — are often viewed as safer dividend picks.
Company Financial Health
Examine fundamentals:
Free cash flow and cash flow stability
Debt load and interest coverage
Profit margins
Growth prospects
Competitive advantage (moat)
A company with healthy cash flow and manageable debt is more likely to sustain and grow dividends.
Sector and Market Trends
Some sectors are inherently more dividend-friendly (utilities, consumer staples, real estate, energy) because they generate steady cash flows. Others (like high-growth tech) may pay little to none in dividends as they reinvest heavily.
Also consider macro conditions — for example, rising interest rates, inflation pressures, regulatory risks — which may disproportionately affect certain sectors.
Tips for Building a Dividend Portfolio
Start with a foundation of blue-chip dividend stocks — Established companies with strong balance sheets and long payout histories.
Diversify across sectors — Avoid being overly concentrated in one industry (e.g. energy or REITs).
Reinvest dividends — Using a Dividend Reinvestment Plan (DRIP) can compound returns over time.
Allocate some portion to growth or higher-yield names, if your risk tolerance allows — but don’t let them dominate.
Review and rebalance periodically — Monitor fundamentals, payout changes, valuation shifts, and sector dynamics.
Use metrics and screening tools — Apply filters (yield, payout ratios, growth, fundamentals) to narrow your universe, then do deeper research.
Mistakes to Avoid about Dividend Stocks
Chasing the highest yield blindly — extremely high yields can indicate a distressed company or impending cuts.
Ignoring payout sustainability — yield without coverage (earnings, cash flow) is precarious.
Overconcentration in one stock or sector — a dividend cut or sector downturn can deeply hurt.
Neglecting growth potential — pure high-yield stocks may underperform in growth cycles.
Forgetting taxes and fees — dividends taxed or fees eroding yield can reduce net returns.
Also, be cautious if yield spikes because of falling share price — that could be a warning sign rather than opportunity.
Frequently Asked Questions About Dividend Stocks
How are dividends taxed?
In the U.S., qualified dividends (if holding periods are met) are taxed at long-term capital gains rates (0 %, 15 %, or 20 %, depending on income bracket). Non-qualified dividends are taxed at ordinary income rates. Additionally, when you sell shares, capital gains taxes may apply to the appreciation portion.
Are dividend stocks good for retirees?
Yes. They can provide a predictable stream of income and may buffer volatility. However, retirees should emphasize safety and sustainability — favor those with strong balance sheets, stable business models, and moderate payout ratios. Also, be aware of tax effects and inflation.
What’s a good dividend yield?
There’s no one “ideal” yield. Many investors view 2 %–6 % as reasonable, depending on the sector and interest rate environment. Yields well above that range warrant extra scrutiny — high yields often come with higher risk.
Are dividend stocks safe for beginners?
They can be, especially when you start with well-known, financially sound dividend payers and diversify. The income cushion helps offset downside risk. But beginners must still research fundamentals, avoid yield traps, and avoid overconcentration.


 Hold
Hold 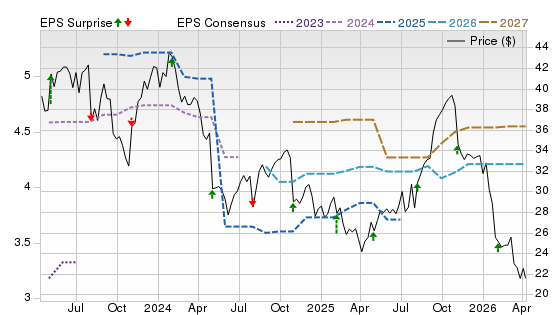
 Hold
Hold 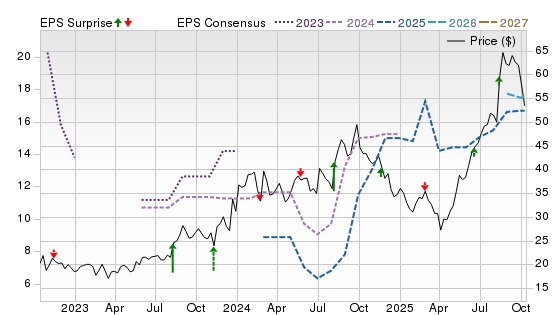


Zacks' 7 Best Strong Buy Stocks (New Research Report)
Valued at $99, click below to receive our just-released report predicting the 7 stocks that will soar highest in the coming month.
Click Here, It's Really Free