We use cookies to understand how you use our site and to improve your experience.
This includes personalizing content and advertising.
By pressing "Accept All" or closing out of this banner, you consent to the use of all cookies and similar technologies and the sharing of information they collect with third parties.
You can reject marketing cookies by pressing "Deny Optional," but we still use essential, performance, and functional cookies.
In addition, whether you "Accept All," Deny Optional," click the X or otherwise continue to use the site, you accept our Privacy Policy and Terms of Service, revised from time to time.
You are being directed to ZacksTrade, a division of LBMZ Securities and licensed broker-dealer. ZacksTrade and Zacks.com are separate companies. The web link between the two companies is not a solicitation or offer to invest in a particular security or type of security. ZacksTrade does not endorse or adopt any particular investment strategy, any analyst opinion/rating/report or any approach to evaluating individual securities.
If you wish to go to ZacksTrade, click OK. If you do not, click Cancel.
Growth stocks have powered a significant share of market gains in recent years.
Growth stocks can carry high valuations and suffer more short-term volatility due to market expectations.
Top growth stocks right now include Delek US, Dell Technologies and Five Below.
Growth stocks have powered a significant share of market gains in recent years, driven by innovation, digital transformation, and expanding global demand. These companies typically reinvest profits to scale operations, launch new products, and capture market share, emphasizing long-term expansion over immediate dividend payouts. From industry-defining technology firms to breakthrough healthcare and consumer brands, growth companies play a pivotal role in many investors’ portfolios.
That potential, however, comes with trade-offs. Growth stocks often carry higher valuations and can be more sensitive to interest rates, earnings expectations, and shifts in market sentiment. Price swings can be sharp, especially when companies fall short of lofty forecasts.
Should you buy a growth stock?
For investors focused on long-term capital appreciation and comfortable with short-term price swings, growth stocks can be powerful long-term wealth builders. Success depends on understanding how these businesses create value, recognizing when growth investing tends to outperform, and knowing how to evaluate opportunities while managing risk within a diversified portfolio.
This is our short term rating system that serves as a timeliness indicator for stocks over the next 1 to 3 months. How good is it? See rankings and related performance below.
The Zacks Industry Rank assigns a rating to each of the 265 X (Expanded) Industries based on their average Zacks Rank.
An industry with a larger percentage of Zacks Rank #1's and #2's will have a better average Zacks Rank than one with a larger percentage of Zacks Rank #4's and #5's.
The industry with the best average Zacks Rank would be considered the top industry (1 out of 265), which would place it in the top 1% of Zacks Ranked Industries. The industry with the worst average Zacks Rank (265 out of 265) would place in the bottom 1%.
The Zacks Sector Rank assigns a rating to each of the 16 Sectors based on their average Zacks Rank.
A sector with a larger percentage of Zacks Rank #1's and #2's will have a better average Zacks Rank than one with a larger percentage of Zacks Rank #4's and #5's.
The sector with the best average Zacks Rank would be considered the top sector (1 out of 16), which would place it in the top 1% of Zacks Ranked Sectors. The sector with the worst average Zacks Rank (16 out of 16) would place in the bottom 1%.
The Style Scores are a complementary set of indicators to use alongside the Zacks Rank. It allows the user to better focus on the stocks that are the best fit for his or her personal trading style.
The scores are based on the trading styles of Value, Growth, and Momentum. There's also a VGM Score ('V' for Value, 'G' for Growth and 'M' for Momentum), which combines the weighted average of the individual style scores into one score.
Value ScoreA
Growth ScoreA
Momentum ScoreA
VGM ScoreA
Within each Score, stocks are graded into five groups: A, B, C, D and F. As you might remember from your school days, an A, is better than a B; a B is better than a C; a C is better than a D; and a D is better than an F.
As an investor, you want to buy stocks with the highest probability of success. That means you want to buy stocks with a Zacks Rank #1 or #2, Strong Buy or Buy, which also has a Score of an A or a B in your personal trading style.
Zacks Earnings ESP (Expected Surprise Prediction) looks to find companies that have recently seen positive earnings estimate revision activity. The idea is that more recent information is, generally speaking, more accurate and can be a better predictor of the future, which can give investors an advantage in earnings season.
The technique has proven to be very useful for finding positive surprises. In fact, when combining a Zacks Rank #3 or better and a positive Earnings ESP, stocks produced a positive surprise 70% of the time, while they also saw 28.3% annual returns on average, according to our 10 year backtest.
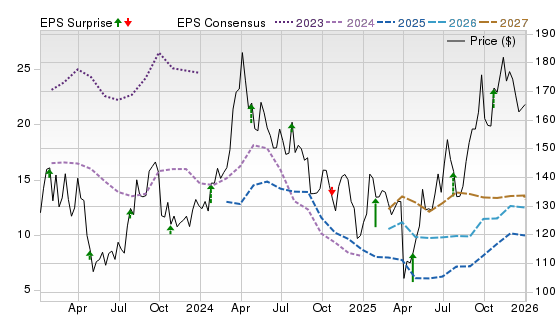
Delek US Holdings is a downstream energy and logistics operator whose upside depends on better refinery reliability, margin capture and cash discipline. In first-quarter 2026, adjusted EBITDA improved year over year, while the Big Spring turnaround finished on time and on budget. The expanded Enterprise Optimization Plan, logistics growth and higher system availability could make earnings less dependent on peak refining spreads.
Potential Risks
Refining margins, crude differentials, RIN costs and unplanned outages remain volatile. Consolidated leverage is meaningful, and expected savings may arrive more slowly than planned.
Forecast
A Zacks Rank #1 (Strong Buy) indicates favorable estimate revisions, while Style Scores of A for Value, Growth and Momentum suggest broad factor support. The Price, Consensus & EPS Surprise chart’s 2026-2028 consensus lines rise sharply. Recent surprises skew positive, and the price breakout implies investors are increasingly pricing in sustained execution rather than a one-quarter rebound.
This is our short term rating system that serves as a timeliness indicator for stocks over the next 1 to 3 months. How good is it? See rankings and related performance below.
The Zacks Industry Rank assigns a rating to each of the 265 X (Expanded) Industries based on their average Zacks Rank.
An industry with a larger percentage of Zacks Rank #1's and #2's will have a better average Zacks Rank than one with a larger percentage of Zacks Rank #4's and #5's.
The industry with the best average Zacks Rank would be considered the top industry (1 out of 265), which would place it in the top 1% of Zacks Ranked Industries. The industry with the worst average Zacks Rank (265 out of 265) would place in the bottom 1%.
The Zacks Sector Rank assigns a rating to each of the 16 Sectors based on their average Zacks Rank.
A sector with a larger percentage of Zacks Rank #1's and #2's will have a better average Zacks Rank than one with a larger percentage of Zacks Rank #4's and #5's.
The sector with the best average Zacks Rank would be considered the top sector (1 out of 16), which would place it in the top 1% of Zacks Ranked Sectors. The sector with the worst average Zacks Rank (16 out of 16) would place in the bottom 1%.
The Style Scores are a complementary set of indicators to use alongside the Zacks Rank. It allows the user to better focus on the stocks that are the best fit for his or her personal trading style.
The scores are based on the trading styles of Value, Growth, and Momentum. There's also a VGM Score ('V' for Value, 'G' for Growth and 'M' for Momentum), which combines the weighted average of the individual style scores into one score.
Value ScoreA
Growth ScoreA
Momentum ScoreA
VGM ScoreA
Within each Score, stocks are graded into five groups: A, B, C, D and F. As you might remember from your school days, an A, is better than a B; a B is better than a C; a C is better than a D; and a D is better than an F.
As an investor, you want to buy stocks with the highest probability of success. That means you want to buy stocks with a Zacks Rank #1 or #2, Strong Buy or Buy, which also has a Score of an A or a B in your personal trading style.
Zacks Earnings ESP (Expected Surprise Prediction) looks to find companies that have recently seen positive earnings estimate revision activity. The idea is that more recent information is, generally speaking, more accurate and can be a better predictor of the future, which can give investors an advantage in earnings season.
The technique has proven to be very useful for finding positive surprises. In fact, when combining a Zacks Rank #3 or better and a positive Earnings ESP, stocks produced a positive surprise 70% of the time, while they also saw 28.3% annual returns on average, according to our 10 year backtest.
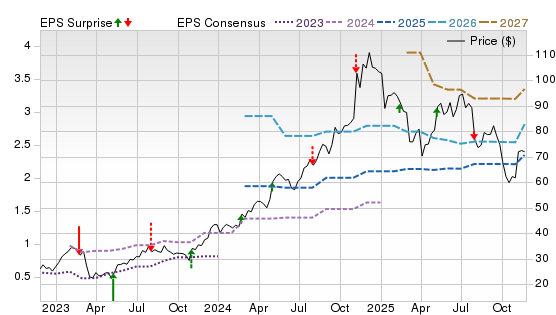
Dell Technologies sells PCs, servers, storage and services, with growth driven by enterprise AI infrastructure. Fiscal first-quarter 2027 revenue and earnings surged from the prior year, but the forward case rests on converting AI-server backlog, expanding storage attach rates and leveraging supply-chain scale. Management’s higher fiscal 2027 outlook suggests AI demand can support growth, while commercial PC refresh activity provides a secondary catalyst.
Potential Risks
AI servers can carry lower margins because of expensive components and customer concentration. Supply constraints, pricing pressure, weaker PC demand, or slower storage recovery could limit operating leverage.
Forecast
A Zacks Rank #1 signals positive estimate revisions. Growth A supports the earnings trajectory, while Value C and Momentum F temper the setup. The chart shows 2026-2028 estimates stepping materially higher, alongside positive surprises. Price volatility suggests investors accept the growth story but remain alert to margin durability.
This is our short term rating system that serves as a timeliness indicator for stocks over the next 1 to 3 months. How good is it? See rankings and related performance below.
The Zacks Industry Rank assigns a rating to each of the 265 X (Expanded) Industries based on their average Zacks Rank.
An industry with a larger percentage of Zacks Rank #1's and #2's will have a better average Zacks Rank than one with a larger percentage of Zacks Rank #4's and #5's.
The industry with the best average Zacks Rank would be considered the top industry (1 out of 265), which would place it in the top 1% of Zacks Ranked Industries. The industry with the worst average Zacks Rank (265 out of 265) would place in the bottom 1%.
The Zacks Sector Rank assigns a rating to each of the 16 Sectors based on their average Zacks Rank.
A sector with a larger percentage of Zacks Rank #1's and #2's will have a better average Zacks Rank than one with a larger percentage of Zacks Rank #4's and #5's.
The sector with the best average Zacks Rank would be considered the top sector (1 out of 16), which would place it in the top 1% of Zacks Ranked Sectors. The sector with the worst average Zacks Rank (16 out of 16) would place in the bottom 1%.
The Style Scores are a complementary set of indicators to use alongside the Zacks Rank. It allows the user to better focus on the stocks that are the best fit for his or her personal trading style.
The scores are based on the trading styles of Value, Growth, and Momentum. There's also a VGM Score ('V' for Value, 'G' for Growth and 'M' for Momentum), which combines the weighted average of the individual style scores into one score.
Value ScoreA
Growth ScoreA
Momentum ScoreA
VGM ScoreA
Within each Score, stocks are graded into five groups: A, B, C, D and F. As you might remember from your school days, an A, is better than a B; a B is better than a C; a C is better than a D; and a D is better than an F.
As an investor, you want to buy stocks with the highest probability of success. That means you want to buy stocks with a Zacks Rank #1 or #2, Strong Buy or Buy, which also has a Score of an A or a B in your personal trading style.
Zacks Earnings ESP (Expected Surprise Prediction) looks to find companies that have recently seen positive earnings estimate revision activity. The idea is that more recent information is, generally speaking, more accurate and can be a better predictor of the future, which can give investors an advantage in earnings season.
The technique has proven to be very useful for finding positive surprises. In fact, when combining a Zacks Rank #3 or better and a positive Earnings ESP, stocks produced a positive surprise 70% of the time, while they also saw 28.3% annual returns on average, according to our 10 year backtest.
Five Below is a value-focused specialty retailer combining unit expansion with recovering comparable sales. First-quarter fiscal 2026 sales and operating income rose sharply from the prior year, yet the stronger forward argument is management’s raised outlook, merchandising and room to add stores. New unit growth, better inventory productivity and clearer price-value communication could support earnings even if comparable sales normalize from strength.
Potential Risks
Tariffs, freight costs and import exposure can pressure its margins. Discretionary demand may weaken, while trend misses, markdowns or cannibalization from rapid expansion could erode returns on new stores.
Forecast
A Zacks Rank #1 reflects upward estimate revisions. Growth A and Momentum B are constructive, while Value C implies recovery is discounted. The chart shows 2026-2028 consensus estimates moving higher. Recent surprises are predominantly positive, and the strong price recovery indicates confidence in a multi-year turnaround.
This is our short term rating system that serves as a timeliness indicator for stocks over the next 1 to 3 months. How good is it? See rankings and related performance below.
The Zacks Industry Rank assigns a rating to each of the 265 X (Expanded) Industries based on their average Zacks Rank.
An industry with a larger percentage of Zacks Rank #1's and #2's will have a better average Zacks Rank than one with a larger percentage of Zacks Rank #4's and #5's.
The industry with the best average Zacks Rank would be considered the top industry (1 out of 265), which would place it in the top 1% of Zacks Ranked Industries. The industry with the worst average Zacks Rank (265 out of 265) would place in the bottom 1%.
The Zacks Sector Rank assigns a rating to each of the 16 Sectors based on their average Zacks Rank.
A sector with a larger percentage of Zacks Rank #1's and #2's will have a better average Zacks Rank than one with a larger percentage of Zacks Rank #4's and #5's.
The sector with the best average Zacks Rank would be considered the top sector (1 out of 16), which would place it in the top 1% of Zacks Ranked Sectors. The sector with the worst average Zacks Rank (16 out of 16) would place in the bottom 1%.
The Style Scores are a complementary set of indicators to use alongside the Zacks Rank. It allows the user to better focus on the stocks that are the best fit for his or her personal trading style.
The scores are based on the trading styles of Value, Growth, and Momentum. There's also a VGM Score ('V' for Value, 'G' for Growth and 'M' for Momentum), which combines the weighted average of the individual style scores into one score.
Value ScoreA
Growth ScoreA
Momentum ScoreA
VGM ScoreA
Within each Score, stocks are graded into five groups: A, B, C, D and F. As you might remember from your school days, an A, is better than a B; a B is better than a C; a C is better than a D; and a D is better than an F.
As an investor, you want to buy stocks with the highest probability of success. That means you want to buy stocks with a Zacks Rank #1 or #2, Strong Buy or Buy, which also has a Score of an A or a B in your personal trading style.
Zacks Earnings ESP (Expected Surprise Prediction) looks to find companies that have recently seen positive earnings estimate revision activity. The idea is that more recent information is, generally speaking, more accurate and can be a better predictor of the future, which can give investors an advantage in earnings season.
The technique has proven to be very useful for finding positive surprises. In fact, when combining a Zacks Rank #3 or better and a positive Earnings ESP, stocks produced a positive surprise 70% of the time, while they also saw 28.3% annual returns on average, according to our 10 year backtest.
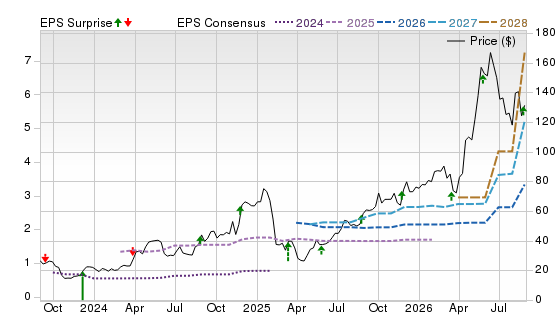
Micron Technology produces DRAM, NAND and high-bandwidth memory, giving it exposure to AI infrastructure growth. Fiscal third-quarter 2026 revenue, margins and cash flow improved dramatically from the prior quarter and year. HBM4 shipments, multi-year customer agreements and constrained leading-edge supply could extend pricing strength and reduce the volatility of memory cycles.
Potential Risks
Aggressive industry investment could eventually create excess supply. Heavy capital spending, customer concentration, China exposure and rapid technology transitions add execution risk. Expectations are exceptionally high, so any moderation in AI demand or pricing could trigger sharp estimate cuts.
Forecast
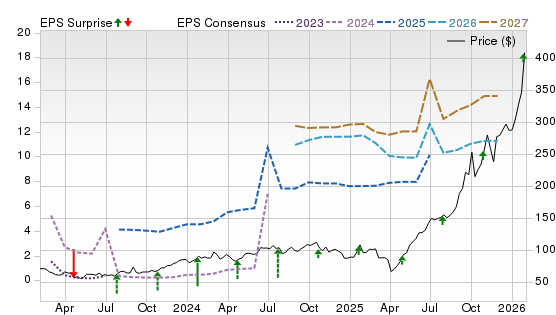
A Zacks Rank #1 points to positive revisions, and the Growth A matches the earnings acceleration. Value D and Momentum F warn that valuation and technical positioning are less supportive. The chart shows 2026-2028 consensus lines rising vertically. Positive surprise markers dominate, but the near-parabolic price move increases reset risk.
This is our short term rating system that serves as a timeliness indicator for stocks over the next 1 to 3 months. How good is it? See rankings and related performance below.
The Zacks Industry Rank assigns a rating to each of the 265 X (Expanded) Industries based on their average Zacks Rank.
An industry with a larger percentage of Zacks Rank #1's and #2's will have a better average Zacks Rank than one with a larger percentage of Zacks Rank #4's and #5's.
The industry with the best average Zacks Rank would be considered the top industry (1 out of 265), which would place it in the top 1% of Zacks Ranked Industries. The industry with the worst average Zacks Rank (265 out of 265) would place in the bottom 1%.
The Zacks Sector Rank assigns a rating to each of the 16 Sectors based on their average Zacks Rank.
A sector with a larger percentage of Zacks Rank #1's and #2's will have a better average Zacks Rank than one with a larger percentage of Zacks Rank #4's and #5's.
The sector with the best average Zacks Rank would be considered the top sector (1 out of 16), which would place it in the top 1% of Zacks Ranked Sectors. The sector with the worst average Zacks Rank (16 out of 16) would place in the bottom 1%.
The Style Scores are a complementary set of indicators to use alongside the Zacks Rank. It allows the user to better focus on the stocks that are the best fit for his or her personal trading style.
The scores are based on the trading styles of Value, Growth, and Momentum. There's also a VGM Score ('V' for Value, 'G' for Growth and 'M' for Momentum), which combines the weighted average of the individual style scores into one score.
Value ScoreA
Growth ScoreA
Momentum ScoreA
VGM ScoreA
Within each Score, stocks are graded into five groups: A, B, C, D and F. As you might remember from your school days, an A, is better than a B; a B is better than a C; a C is better than a D; and a D is better than an F.
As an investor, you want to buy stocks with the highest probability of success. That means you want to buy stocks with a Zacks Rank #1 or #2, Strong Buy or Buy, which also has a Score of an A or a B in your personal trading style.
Zacks Earnings ESP (Expected Surprise Prediction) looks to find companies that have recently seen positive earnings estimate revision activity. The idea is that more recent information is, generally speaking, more accurate and can be a better predictor of the future, which can give investors an advantage in earnings season.
The technique has proven to be very useful for finding positive surprises. In fact, when combining a Zacks Rank #3 or better and a positive Earnings ESP, stocks produced a positive surprise 70% of the time, while they also saw 28.3% annual returns on average, according to our 10 year backtest.
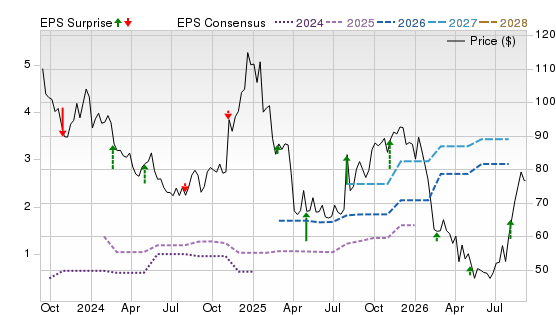
Liquidia is a commercial-stage biotech focused on pulmonary hypertension, led by YUTREPIA and its PRINT platform. First-quarter 2026 sales, profitability and cash improved from the prelaunch period. The forward case centers on broader YUTREPIA adoption, deeper prescriber penetration and L606 pipeline expansion, which could diversify growth beyond a single inhaled product.
Potential Risks
The thesis remains dependent on YUTREPIA uptake, reimbursement and physician switching. Patent litigation, regulatory setbacks, trial delays or heavier launch spending could reduce cash generation.
Forecast
A Zacks Rank #1 signals favorable estimate revisions, while Growth A captures the launch-driven earnings inflection. Value F and Momentum D highlight limited valuation support and weaker technical confirmation. The chart shows 2026, 2027 and 2028 estimates climbing sharply. Recent EPS surprises are mostly positive, but the steep share-price advance leaves the stock highly sensitive to prescription trends and execution.
The Zacks Rank is a proprietary stock-rating model that uses trends in earnings estimate revisions and earnings-per-share (EPS) surprises to classify stocks into five groups: #1 (Strong Buy), #2 (Buy), #3 (Hold), #4 (Sell) and #5 (Strong Sell). The Zacks Rank is calculated through four primary factors related to earnings estimates: analysts' consensus on earnings estimate revisions, the magnitude of revision change, the upside potential and estimate surprise (or the degree in which earnings per share deviated from the previous quarter).
Zacks builds the data from 3,000 analysts at over 150 different brokerage firms. The average yearly gain for Zacks Rank #1 (Strong Buy) stocks is +23.94% per year from January 1, 1988, through July 6, 2026.
Selections for Best Growth Stocks are based on the current top ranking stocks based on Zacks Indicator Score, Style Scores and fundamentals. For this list, only companies that have average daily trading volumes of 100,000 shares or more were considered, as well as companies from the top 50% of all industries. All information is current as of market open July 28, 2026.
General Questions About Growth Stocks
What is a growth stock?
A growth stock represents a company expected to grow sales, earnings, or cash flow faster than the broader market. These firms often operate in expanding industries and reinvest heavily in research, marketing, and infrastructure to sustain momentum.
What are the benefits of buying growth stocks?
Growth stocks offer the potential for significant price appreciation, exposure to innovative business models, and long-term compounding. When successful, they can outperform more mature companies by a wide margin.
What are the risks of buying growth stocks?
Higher valuations, sensitivity to interest rates, and reliance on future earnings projections increase downside risk. If growth slows or expectations fall, share prices can decline sharply.
Growth vs. value stocks: What’s better right now?
Growth stocks tend to excel during periods of economic expansion and technological change, while value stocks often perform better when investors prioritize stability and income. Market leadership can rotate, making diversification across styles important.
Are growth stocks a good investment during economic uncertainty?
During uncertain periods, growth stocks may experience heightened volatility. Companies with strong balance sheets, recurring revenue, and durable demand tend to hold up better than speculative names.
How do growth stocks differ from dividend stocks?
Dividend stocks focus on returning cash to shareholders, while growth stocks reinvest profits to fuel expansion. Investors often choose growth for appreciation and dividends for income.
Are growth stocks suitable for beginners?
They can be, especially through diversified funds or established large-cap names. Beginners should avoid concentrating too heavily in speculative or unprofitable companies.
How do growth stocks perform during recessions?
Performance varies. Some growth companies with essential products continue to expand, while others tied to discretionary spending may struggle.
Look for consistent revenue growth, expanding addressable markets, competitive advantages, and strong management execution.
What metrics should I look at in growth stocks?
Common metrics include revenue growth rates, earnings growth, free cash flow trends, return on invested capital, and valuation ratios relative to growth expectations.
What ETFs contain the best growth stocks?
Growth-focused ETFs often track large-cap or sector-specific indexes, offering exposure to leading growth companies while reducing single-stock risk.
Should I diversify my growth stock portfolio?
Yes. Diversifying across sectors, company sizes, and geographies can help manage volatility and reduce reliance on any single trend.
Are growth stocks a good investment during economic uncertainty?
Quality growth stocks with pricing power and resilient demand can still perform well, but position sizing and diversification are critical.
What sectors typically produce strong growth stocks?
Certain sectors consistently produce growth leaders due to innovation, scale advantages, or long-term demand trends. Examples include:
Technology and AI: Companies benefiting from cloud computing, artificial intelligence, and software platforms, such as NVIDIA, Microsoft, Alphabet, and Amazon.
Consumer Discretionary: Brands and platforms capturing shifts in consumer behavior and digital commerce, including Tesla, Amazon, and Booking Holdings.
Healthcare and Biotechnology: Firms developing breakthrough drugs, medical devices, or diagnostics, such as Eli Lilly, Novo Nordisk, Vertex Pharmaceuticals, and Intuitive Surgical.
Communication Services: Digital advertising, streaming, and social platforms with scalable user bases, including Meta Platforms and Netflix.
Financial Technology: Companies modernizing payments, trading, and financial infrastructure, such as Visa, Mastercard, and Block.
Clean Energy and Electrification: Businesses tied to renewable power, battery technology, and grid modernization, including NextEra Energy, Enphase Energy, and Tesla.
These sectors frequently generate high-growth opportunities, though leadership within them can change over time.
Do growth stocks work for long-term or short-term strategies?
They are generally better suited for long-term investing, allowing time for innovation and expansion to translate into earnings growth.
What are common mistakes to avoid when investing in growth stocks?
Chasing hype, ignoring valuation, overconcentration, and selling too quickly during volatility are frequent pitfalls.
How to Purchase Growth Stocks
Do I need a broker to buy growth stocks?
Yes. Most investors use online brokerage platforms that offer access to individual stocks, ETFs, and research tools.
How much should I invest in my first growth stock purchase?
Start with an amount that fits your overall financial plan and risk tolerance. Many investors begin with smaller positions and add over time.
Strategies for Buying Growth Stocks
How often should I rebalance a growth-focused portfolio?
Rebalancing annually or semiannually helps maintain target allocations and manage risk.
When should I sell a growth stock?
Consider selling if the company’s fundamentals deteriorate, growth prospects fade, or the position becomes too large relative to your portfolio.
How do I track performance and assess whether a growth stock is still strong?
Monitor earnings reports, revenue trends, competitive positioning, and management guidance.
What tax implications come with selling growth stocks?
Selling at a profit may trigger capital gains taxes, with rates depending on holding period and income level.
Growth Stock Alternatives
Are index funds a safer alternative to picking growth stocks?
Index funds provide broad exposure and lower risk than individual stock selection, making them appealing for many investors.
What are conservative investment options if growth stocks are too risky?
Options include value stocks, dividend-paying equities, bonds, and balanced funds that emphasize capital preservation.