-

AAPL
Apple
-
#1
-

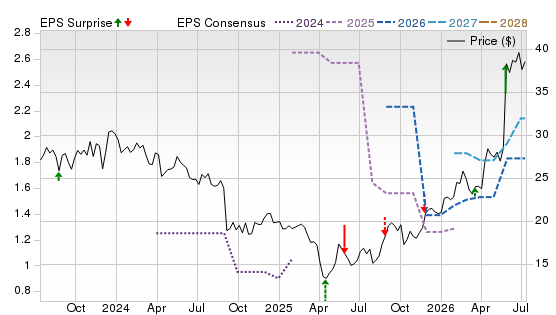
MU
Micron Technology
-
#2
-

NVDA
NVIDIA
-
#3
-

SNDK
Sandisk Corporation
-
#4
-

INTC
Intel
-
#5
-

SPCX
Space Exploration Technologies Corp.
-
#6
-

MSFT
Microsoft
-
#7


 Hold
Hold 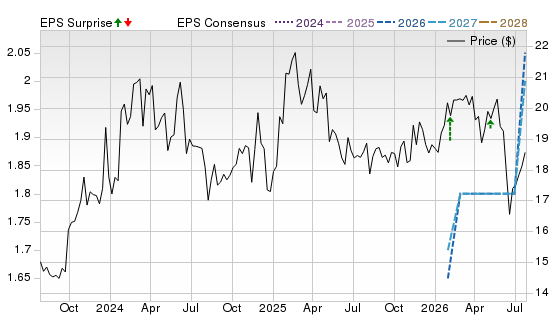
 Strong Buy
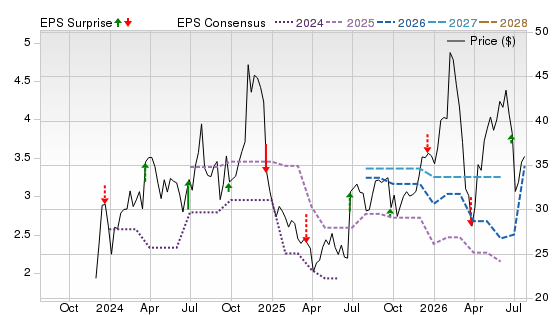


 Stocks to Buy Now August 2026")


