We use cookies to understand how you use our site and to improve your experience.
This includes personalizing content and advertising.
By pressing "Accept All" or closing out of this banner, you consent to the use of all cookies and similar technologies and the sharing of information they collect with third parties.
You can reject marketing cookies by pressing "Deny Optional," but we still use essential, performance, and functional cookies.
In addition, whether you "Accept All," Deny Optional," click the X or otherwise continue to use the site, you accept our Privacy Policy and Terms of Service, revised from time to time.
You are being directed to ZacksTrade, a division of LBMZ Securities and licensed broker-dealer. ZacksTrade and Zacks.com are separate companies. The web link between the two companies is not a solicitation or offer to invest in a particular security or type of security. ZacksTrade does not endorse or adopt any particular investment strategy, any analyst opinion/rating/report or any approach to evaluating individual securities.
If you wish to go to ZacksTrade, click OK. If you do not, click Cancel.
Eli Lilly became the first pharmaceutical company to top $1 trillion in market value in 2025.
An aging population and improvements in technology are fueling the growth and promise of pharma stocks.
The best pharmaceutical stocks to buy now include five companies with promising drug pipelines.
Eli Lilly (LLY), the Indianapolis-based drugmaker, recently made news by becoming the first pharmaceutical company to top $1 trillion in market value, thanks in part to its breakout weight-loss drugs, Mounjaro and Zepbound. Are other pharma stocks worth a look?
Are Pharmaceutical Stocks a Good Investment?
Pharmaceutical firms have long been viewed as a blend of defensive income plays and growth opportunities. As demand for medicines, vaccines, and chronic-disease treatments remains steady regardless of economic cycles, pharma companies often deliver stable earnings. That stability — combined with generous dividends many pharma companies pay — makes them especially attractive when the broader market is choppy or inflation is high.
Additionally, the global pharmaceutical industry continues to grow: Analysts expect the sector to expand over the coming years, aided by rising demand for treatments for chronic illnesses, oncology, vaccines and demographic factors such as aging populations.
However, pharmaceutical investing isn’t risk-free. Outcomes often depend on R&D success, regulatory approvals, patent expirations, and competitive pressures. That’s why smart investors often balance stable dividend-payers with growth-oriented firms or diversify across multiple names.
Here, we analyze and rank the best pharmaceutical stocks to buy now ranked on a blend Zacks Rank signals, Style Scores and fundamentals:
This is our short term rating system that serves as a timeliness indicator for stocks over the next 1 to 3 months. How good is it? See rankings and related performance below.
The Zacks Industry Rank assigns a rating to each of the 265 X (Expanded) Industries based on their average Zacks Rank.
An industry with a larger percentage of Zacks Rank #1's and #2's will have a better average Zacks Rank than one with a larger percentage of Zacks Rank #4's and #5's.
The industry with the best average Zacks Rank would be considered the top industry (1 out of 265), which would place it in the top 1% of Zacks Ranked Industries. The industry with the worst average Zacks Rank (265 out of 265) would place in the bottom 1%.
The Zacks Sector Rank assigns a rating to each of the 16 Sectors based on their average Zacks Rank.
A sector with a larger percentage of Zacks Rank #1's and #2's will have a better average Zacks Rank than one with a larger percentage of Zacks Rank #4's and #5's.
The sector with the best average Zacks Rank would be considered the top sector (1 out of 16), which would place it in the top 1% of Zacks Ranked Sectors. The sector with the worst average Zacks Rank (16 out of 16) would place in the bottom 1%.
The Style Scores are a complementary set of indicators to use alongside the Zacks Rank. It allows the user to better focus on the stocks that are the best fit for his or her personal trading style.
The scores are based on the trading styles of Value, Growth, and Momentum. There's also a VGM Score ('V' for Value, 'G' for Growth and 'M' for Momentum), which combines the weighted average of the individual style scores into one score.
Value ScoreA
Growth ScoreA
Momentum ScoreA
VGM ScoreA
Within each Score, stocks are graded into five groups: A, B, C, D and F. As you might remember from your school days, an A, is better than a B; a B is better than a C; a C is better than a D; and a D is better than an F.
As an investor, you want to buy stocks with the highest probability of success. That means you want to buy stocks with a Zacks Rank #1 or #2, Strong Buy or Buy, which also has a Score of an A or a B in your personal trading style.
Zacks Earnings ESP (Expected Surprise Prediction) looks to find companies that have recently seen positive earnings estimate revision activity. The idea is that more recent information is, generally speaking, more accurate and can be a better predictor of the future, which can give investors an advantage in earnings season.
The technique has proven to be very useful for finding positive surprises. In fact, when combining a Zacks Rank #3 or better and a positive Earnings ESP, stocks produced a positive surprise 70% of the time, while they also saw 28.3% annual returns on average, according to our 10 year backtest.
Amneal Pharmaceuticals makes affordable medicines, including generics, specialty drugs and biosimilars. Its planned Kashiv acquisition could make it stronger in biosimilars, with over 20 products in development and more than 12 commercial products expected by 2030. The deal may also expand manufacturing capacity, lift revenue toward $4.25 to $4.5 billion by 2030, and help reduce debt over time.
Potential Risks
The deal remains subject to shareholder approval and closing conditions; delays, higher costs, litigation, regulatory issues or integration disruptions could materially affect results and timing for investors later.
Forecast
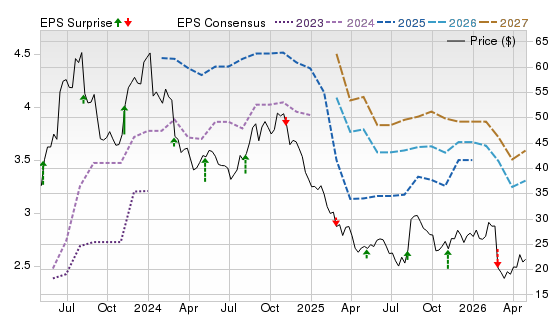
A Zacks Rank #2 (Buy) with an A Value Score and B Growth Score point to supportive revisions and an inexpensive setup, though the Momentum Score of F warns price action can lag. The chart shows 2026–2027 EPS consensus stair-stepping higher with mostly positive surprises, suggesting estimates can keep drifting up if execution holds.
This is our short term rating system that serves as a timeliness indicator for stocks over the next 1 to 3 months. How good is it? See rankings and related performance below.
The Zacks Industry Rank assigns a rating to each of the 265 X (Expanded) Industries based on their average Zacks Rank.
An industry with a larger percentage of Zacks Rank #1's and #2's will have a better average Zacks Rank than one with a larger percentage of Zacks Rank #4's and #5's.
The industry with the best average Zacks Rank would be considered the top industry (1 out of 265), which would place it in the top 1% of Zacks Ranked Industries. The industry with the worst average Zacks Rank (265 out of 265) would place in the bottom 1%.
The Zacks Sector Rank assigns a rating to each of the 16 Sectors based on their average Zacks Rank.
A sector with a larger percentage of Zacks Rank #1's and #2's will have a better average Zacks Rank than one with a larger percentage of Zacks Rank #4's and #5's.
The sector with the best average Zacks Rank would be considered the top sector (1 out of 16), which would place it in the top 1% of Zacks Ranked Sectors. The sector with the worst average Zacks Rank (16 out of 16) would place in the bottom 1%.
The Style Scores are a complementary set of indicators to use alongside the Zacks Rank. It allows the user to better focus on the stocks that are the best fit for his or her personal trading style.
The scores are based on the trading styles of Value, Growth, and Momentum. There's also a VGM Score ('V' for Value, 'G' for Growth and 'M' for Momentum), which combines the weighted average of the individual style scores into one score.
Value ScoreA
Growth ScoreA
Momentum ScoreA
VGM ScoreA
Within each Score, stocks are graded into five groups: A, B, C, D and F. As you might remember from your school days, an A, is better than a B; a B is better than a C; a C is better than a D; and a D is better than an F.
As an investor, you want to buy stocks with the highest probability of success. That means you want to buy stocks with a Zacks Rank #1 or #2, Strong Buy or Buy, which also has a Score of an A or a B in your personal trading style.
Zacks Earnings ESP (Expected Surprise Prediction) looks to find companies that have recently seen positive earnings estimate revision activity. The idea is that more recent information is, generally speaking, more accurate and can be a better predictor of the future, which can give investors an advantage in earnings season.
The technique has proven to be very useful for finding positive surprises. In fact, when combining a Zacks Rank #3 or better and a positive Earnings ESP, stocks produced a positive surprise 70% of the time, while they also saw 28.3% annual returns on average, according to our 10 year backtest.
Phibro Animal Health makes products that help keep farm animals healthy, including feed additives, nutrition products and vaccines. The company may keep benefiting from steady demand for animal protein, as Q3 fiscal year 2026 sales rose 10% and Animal Health sales grew 13%. Its updated fiscal year 2026 outlook also points to higher expected sales, adjusted EBITDA and adjusted EPS, supporting a positive pharma-stock view.
Potential Risks
Risks include Brazil’s rules on some antimicrobial products, weaker Performance Products sales, lower Mineral Nutrition margins, and debt levels that may limit flexibility.
Forecast
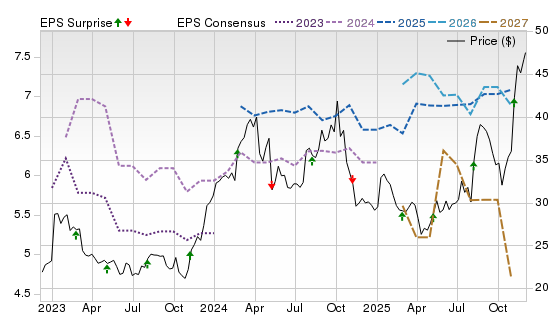
A Zacks Rank #3 (Hold) is neutral, but A scores for Value and Momentum suggest a favorable mix of valuation and trend, even as the Growth Score of F flags limited near-term earnings acceleration. The chart shows a powerful price uptrend alongside 2026–2027 EPS lines moving steadily higher and a recent run of beats, supporting further revisions despite pullbacks.
This is our short term rating system that serves as a timeliness indicator for stocks over the next 1 to 3 months. How good is it? See rankings and related performance below.
The Zacks Industry Rank assigns a rating to each of the 265 X (Expanded) Industries based on their average Zacks Rank.
An industry with a larger percentage of Zacks Rank #1's and #2's will have a better average Zacks Rank than one with a larger percentage of Zacks Rank #4's and #5's.
The industry with the best average Zacks Rank would be considered the top industry (1 out of 265), which would place it in the top 1% of Zacks Ranked Industries. The industry with the worst average Zacks Rank (265 out of 265) would place in the bottom 1%.
The Zacks Sector Rank assigns a rating to each of the 16 Sectors based on their average Zacks Rank.
A sector with a larger percentage of Zacks Rank #1's and #2's will have a better average Zacks Rank than one with a larger percentage of Zacks Rank #4's and #5's.
The sector with the best average Zacks Rank would be considered the top sector (1 out of 16), which would place it in the top 1% of Zacks Ranked Sectors. The sector with the worst average Zacks Rank (16 out of 16) would place in the bottom 1%.
The Style Scores are a complementary set of indicators to use alongside the Zacks Rank. It allows the user to better focus on the stocks that are the best fit for his or her personal trading style.
The scores are based on the trading styles of Value, Growth, and Momentum. There's also a VGM Score ('V' for Value, 'G' for Growth and 'M' for Momentum), which combines the weighted average of the individual style scores into one score.
Value ScoreA
Growth ScoreA
Momentum ScoreA
VGM ScoreA
Within each Score, stocks are graded into five groups: A, B, C, D and F. As you might remember from your school days, an A, is better than a B; a B is better than a C; a C is better than a D; and a D is better than an F.
As an investor, you want to buy stocks with the highest probability of success. That means you want to buy stocks with a Zacks Rank #1 or #2, Strong Buy or Buy, which also has a Score of an A or a B in your personal trading style.
Zacks Earnings ESP (Expected Surprise Prediction) looks to find companies that have recently seen positive earnings estimate revision activity. The idea is that more recent information is, generally speaking, more accurate and can be a better predictor of the future, which can give investors an advantage in earnings season.
The technique has proven to be very useful for finding positive surprises. In fact, when combining a Zacks Rank #3 or better and a positive Earnings ESP, stocks produced a positive surprise 70% of the time, while they also saw 28.3% annual returns on average, according to our 10 year backtest.
Enliven Therapeutics is a biotech company trying to develop new cancer medicines, not selling approved drugs yet. The stock’s future may depend mainly on ELVN-001, its lead blood-cancer drug candidate, as the company moves it toward a larger key trial. Its $452.4 million cash and investment balance should help fund planned work for at least 12 months from the filing date.
Potential Risks
Enliven has no product sales, keeps losing money, depends heavily on ELVN-001, and may need more funding if trials take longer or disappoint.
Forecast
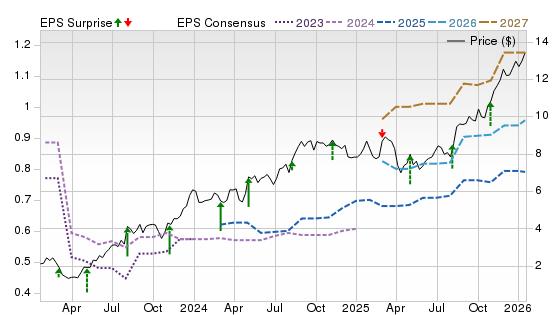
A Zacks Rank #3 with a C Value Score and B scores for Growth and Momentum suggests balanced near-term expectations, with valuation less of a tailwind than higher-ranked peers. The chart shows a sharp recent price spike while 2026 EPS expectations edge up and surprises are limited, implying near-term direction will track upcoming data more than estimate drift.
This is our short term rating system that serves as a timeliness indicator for stocks over the next 1 to 3 months. How good is it? See rankings and related performance below.
The Zacks Industry Rank assigns a rating to each of the 265 X (Expanded) Industries based on their average Zacks Rank.
An industry with a larger percentage of Zacks Rank #1's and #2's will have a better average Zacks Rank than one with a larger percentage of Zacks Rank #4's and #5's.
The industry with the best average Zacks Rank would be considered the top industry (1 out of 265), which would place it in the top 1% of Zacks Ranked Industries. The industry with the worst average Zacks Rank (265 out of 265) would place in the bottom 1%.
The Zacks Sector Rank assigns a rating to each of the 16 Sectors based on their average Zacks Rank.
A sector with a larger percentage of Zacks Rank #1's and #2's will have a better average Zacks Rank than one with a larger percentage of Zacks Rank #4's and #5's.
The sector with the best average Zacks Rank would be considered the top sector (1 out of 16), which would place it in the top 1% of Zacks Ranked Sectors. The sector with the worst average Zacks Rank (16 out of 16) would place in the bottom 1%.
The Style Scores are a complementary set of indicators to use alongside the Zacks Rank. It allows the user to better focus on the stocks that are the best fit for his or her personal trading style.
The scores are based on the trading styles of Value, Growth, and Momentum. There's also a VGM Score ('V' for Value, 'G' for Growth and 'M' for Momentum), which combines the weighted average of the individual style scores into one score.
Value ScoreA
Growth ScoreA
Momentum ScoreA
VGM ScoreA
Within each Score, stocks are graded into five groups: A, B, C, D and F. As you might remember from your school days, an A, is better than a B; a B is better than a C; a C is better than a D; and a D is better than an F.
As an investor, you want to buy stocks with the highest probability of success. That means you want to buy stocks with a Zacks Rank #1 or #2, Strong Buy or Buy, which also has a Score of an A or a B in your personal trading style.
Zacks Earnings ESP (Expected Surprise Prediction) looks to find companies that have recently seen positive earnings estimate revision activity. The idea is that more recent information is, generally speaking, more accurate and can be a better predictor of the future, which can give investors an advantage in earnings season.
The technique has proven to be very useful for finding positive surprises. In fact, when combining a Zacks Rank #3 or better and a positive Earnings ESP, stocks produced a positive surprise 70% of the time, while they also saw 28.3% annual returns on average, according to our 10 year backtest.
Amphastar makes specialty medicines and controls key steps, from product development to manufacturing and sales. Future growth could come from wider BAQSIMI glucagon nasal powder reach, stronger advertising and doctor sampling for Primatene MIST epinephrine inhalation product, recent launches of iron sucrose, teriparatide and ipratropium bromide, and expected 2027 launches of glucagon-like peptide-1 AMP-018 and insulin aspart AMP-004.
Potential Risks
The stock may face near-term pressure if planned launches, regulatory steps or clinical work take longer than expected. BAQSIMI’s slower 2026 outlook and heavier research spending could also weigh on earnings.
Forecast
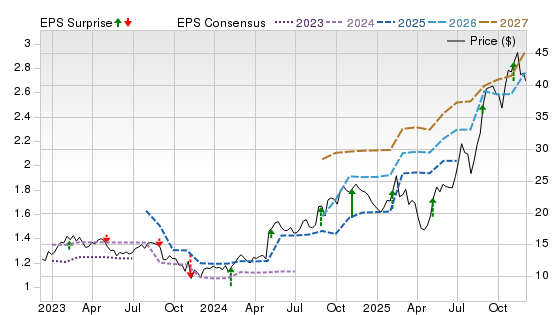
A Zacks Rank #3 with an A Value Score, D Growth Score, and C Momentum Score reads as cheap, but execution must re-accelerate, with price action supportive but not yet signaling a decisive turn. The chart shows price well off prior highs and 2026–2027 EPS consensus stepping down with mixed surprises, so the key catalyst is stabilizing revisions.
This is our short term rating system that serves as a timeliness indicator for stocks over the next 1 to 3 months. How good is it? See rankings and related performance below.
The Zacks Industry Rank assigns a rating to each of the 265 X (Expanded) Industries based on their average Zacks Rank.
An industry with a larger percentage of Zacks Rank #1's and #2's will have a better average Zacks Rank than one with a larger percentage of Zacks Rank #4's and #5's.
The industry with the best average Zacks Rank would be considered the top industry (1 out of 265), which would place it in the top 1% of Zacks Ranked Industries. The industry with the worst average Zacks Rank (265 out of 265) would place in the bottom 1%.
The Zacks Sector Rank assigns a rating to each of the 16 Sectors based on their average Zacks Rank.
A sector with a larger percentage of Zacks Rank #1's and #2's will have a better average Zacks Rank than one with a larger percentage of Zacks Rank #4's and #5's.
The sector with the best average Zacks Rank would be considered the top sector (1 out of 16), which would place it in the top 1% of Zacks Ranked Sectors. The sector with the worst average Zacks Rank (16 out of 16) would place in the bottom 1%.
The Style Scores are a complementary set of indicators to use alongside the Zacks Rank. It allows the user to better focus on the stocks that are the best fit for his or her personal trading style.
The scores are based on the trading styles of Value, Growth, and Momentum. There's also a VGM Score ('V' for Value, 'G' for Growth and 'M' for Momentum), which combines the weighted average of the individual style scores into one score.
Value ScoreA
Growth ScoreA
Momentum ScoreA
VGM ScoreA
Within each Score, stocks are graded into five groups: A, B, C, D and F. As you might remember from your school days, an A, is better than a B; a B is better than a C; a C is better than a D; and a D is better than an F.
As an investor, you want to buy stocks with the highest probability of success. That means you want to buy stocks with a Zacks Rank #1 or #2, Strong Buy or Buy, which also has a Score of an A or a B in your personal trading style.
Zacks Earnings ESP (Expected Surprise Prediction) looks to find companies that have recently seen positive earnings estimate revision activity. The idea is that more recent information is, generally speaking, more accurate and can be a better predictor of the future, which can give investors an advantage in earnings season.
The technique has proven to be very useful for finding positive surprises. In fact, when combining a Zacks Rank #3 or better and a positive Earnings ESP, stocks produced a positive surprise 70% of the time, while they also saw 28.3% annual returns on average, according to our 10 year backtest.
Collegium is a diversified biopharmaceutical company focused on ADHD and pain medicines. Its 2026 outlook points to net product revenue of $865-$895 million and adjusted EBITDA of $475-$500 million, while priorities include growing JORNAY PM, integrating AZSTARYS, sustaining the pain portfolio and deploying capital, which could support revenue durability, portfolio diversification and cash-flow generation over time for pharma investors ahead.
Potential Risks
Risks include stimulant and opioid abuse warnings, respiratory-depression concerns for pain brands, reimbursement dependence, market-acceptance uncertainty, regulatory scrutiny, competition and integration risk after AZSTARYS acquisition and debt-funded execution.
Forecast
A Zacks Rank #3 with Style Scores of A for Value and B for Growth suggest solid fundamentals at a reasonable price, though C Momentum implies uneven trading. The chart shows choppy price action, 2025–2026 EPS consensus gradually rising, and a mixed beat/miss pattern—pointing to steady but bumpy estimate progress.
The Zacks Rank is a proprietary stock-rating model that uses trends in earnings estimate revisions and earnings-per-share (EPS) surprises to classify stocks into five groups: #1 (Strong Buy), #2 (Buy), #3 (Hold), #4 (Sell) and #5 (Strong Sell). The Zacks Rank is calculated through four primary factors related to earnings estimates: analysts' consensus on earnings estimate revisions, the magnitude of revision change, the upside potential and estimate surprise (or the degree in which earnings per share deviated from the previous quarter).
Zacks builds the data from 3,000 analysts at over 150 different brokerage firms. The average yearly gain for Zacks Rank #1 (Strong Buy) stocks is +23.62% per year from January, 1988, through June 2, 2025.
Selections for Best Pharmaceutical Stocks are based on the current top ranking stocks based on Zacks Indicator Score and other factors. For this list, only companies that have average daily trading volumes of 100,000 shares or more are considered. All information is current as of market open, May 29, 2026.
Learn More about Pharmaceutical Stocks
What are Pharmaceutical Stocks?
“Pharmaceutical stocks” refer to publicly traded companies engaged primarily in the discovery, development, manufacturing, and sale of drugs — including brand-name medicines, biologics, vaccines and sometimes generics.
Types of Pharmaceutical Stocks
Large-cap, established pharmaceutical companies – These are the global leaders with diverse drug portfolios, steady revenue streams, and long histories of paying dividends. Examples include Pfizer (PFE - Free Report), Merck (MRK - Free Report), Johnson & Johnson (JNJ - Free Report), AbbVie (ABBV - Free Report), Bristol-Myers Squibb (BMY - Free Report) and Novartis (NVS). These companies tend to have well-funded pipelines and wide geographic reach, making them popular with conservative investors.
Specialty-drug and focused biopharma firms – These companies concentrate on specific therapeutic areas such as rare diseases, oncology, immunology, or metabolic conditions. They can deliver strong growth if a breakthrough therapy succeeds. Examples include Vertex Pharmaceuticals (VRTX - Free Report) in genetic diseases, Regeneron (REGN - Free Report) in immunology and ophthalmology, Incyte (INCY - Free Report) in oncology and Horizon Therapeutics (HZNP - Free Report) in autoimmune disorders.
Pipeline-driven or R&D-intensive pharmaceutical developers – These companies may have fewer commercialized drugs but invest heavily in research, clinical trials, and next-generation treatments. Revenue may be uneven, but the upside can be significant if major approvals come through. Notable examples include Moderna (MRNA - Free Report) in mRNA therapeutics, BioNTech (BNTX - Free Report) in immuno-oncology, Alnylam Pharmaceuticals (ALNY - Free Report) in RNA interference drugs and Sarepta Therapeutics (SRPT - Free Report) in genetic therapies.
Pros of Pharmaceutical Stocks
Consistent demand for medicines: Healthcare needs remain steady regardless of economic cycles, helping companies like Merck, Eli Lilly (LLY - Free Report), or AstraZeneca (AZN - Free Report) maintain dependable revenue.
Attractive dividends: Many large pharmaceutical companies, such as Pfizer, AbbVie, and Johnson & Johnson, are known for long-standing dividend programs and high payout reliability.
Potential for major upside from drug launches: A successful approval or breakthrough therapy—such as Eli Lilly’s diabetes/obesity drugs or Regeneron’s eye-disease treatments—can significantly boost a company’s valuation.
Diversification within healthcare: Pharma stocks often behave differently from technology, consumer, or financial sectors, providing balance to an investment portfolio.
Cons of Pharmaceutical Stocks
Regulatory hurdles: Failure to secure FDA approval, clinical-trial setbacks, or safety concerns can sharply impact valuations when trials don’t meet expectations.
Patent cliffs and generic competition: Once exclusivity ends, branded drugs can face rapid erosion from generics or biosimilars. For instance, AbbVie’s Humira — once the world’s top-selling drug — saw sales drop after biosimilar competition entered the market.
Competitive pressures: New drugs from rivals can displace existing blockbusters. For example, Novo Nordisk (NVO - Free Report) and Eli Lilly (LLY) dominate the obesity/diabetes segment, squeezing competitors.
High research costs and uncertainties: Pharma R&D is expensive and unpredictable. Firms like Moderna, Alnylam, or Sarepta often experience stock volatility tied directly to clinical-trial outcomes or scientific feasibility.
Best Pharmaceutical Stocks vs. Biotechnology Stocks: Which Is Better?
Pharmaceutical companies (large-cap pharma) These firms—such as Merck, Pfizer, AbbVie, and Novartis—tend to be more stable due to established product lines and recurring revenue. They typically appeal to income-focused investors because they often pay strong and consistent dividends.
Biotechnology companies Biotech firms like Regeneron, Vertex, Moderna, and BioNTech often target cutting-edge scientific approaches with high growth potential. Their revenues can surge when a breakthrough therapy succeeds, but they face much greater volatility and dependency on research outcomes.
If you prefer steady dividends and lower volatility, large U.S. and international pharma names are generally a better fit.
If you’re seeking high potential returns and can handle larger price swings, biotech and R&D-intensive drug developers may offer superior upside.
Many investors blend both categories to balance income with innovation-driven growth.
Risks and Safety
How do FDA approvals impact stock prices?
Securing FDA approval for a new drug can be a major catalyst: positive news can dramatically boost stock price. Conversely, delays, negative trial results, or regulatory setbacks can result in sharp declines. That’s why even solid firms factor in “uncertainty rating” — because much hinges on regulatory success.
How do patent expirations affect pharmaceutical stocks?
When a drug’s patent expires, generics may enter, often severely reducing sales for the original drug — which can lead to revenue decline unless the company successfully replaces the lost revenue with new drugs or therapies.
What are the biggest risks when investing in drug companies?
R&D failure and sunk costs.
Regulatory hurdles and unpredictable approval processes.
Litigation, pricing pressure, changes in healthcare policy and regulation.
Concentration risk if a company relies heavily on a few blockbuster drugs.
Pharmaceutical Stocks Trends
Which pharmaceutical stock benefits the most from aging population trends?
Large-cap companies with broad portfolios — especially those offering treatments for chronic diseases (e.g., cardiovascular, cancer, auto-immune, diabetes) — tend to benefit from demographic trends. Firms like Merck, AbbVie, and others with diversified pipelines may be especially well positioned.
How have pharmaceutical stocks performed in the last 5 years?
Many large-cap pharma stocks have offered attractive dividend yields and moderate growth, often outperforming more cyclical sectors, especially in volatile markets. Their relative resilience and dividends have appealed to investors seeking stability.
Are pharma stocks recession-proof?
Not entirely — but compared with consumer discretionary or cyclical sectors, pharma tends to be more resilient. Demand for essential medicines tends to remain stable even during economic downturns, giving pharma a defensive characteristic.
How to Invest in Pharmaceutical Stocks
Should beginners invest in pharma ETFs instead of single stocks?
Yes — for many retail investors, pharma-focused ETFs (or broader healthcare ETFs) offer diversified exposure, reducing the risk of overconcentration in a single company. This mitigates risks like regulatory failure or drug-specific setbacks.
Is it better to invest in global or U.S. pharmaceutical companies?
Both have advantages. U.S. firms often lead in innovation, R&D, and large-scale global distribution. International companies may offer exposure to different markets, drug pipelines, and potentially attractive valuations. A mix of both can provide balanced diversification.




 View the Zacks #1 Rank List


 Hold
Hold 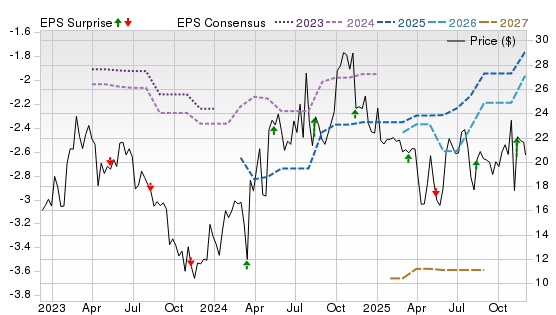
 Buy
Buy