We use cookies to understand how you use our site and to improve your experience.
This includes personalizing content and advertising.
By pressing "Accept All" or closing out of this banner, you consent to the use of all cookies and similar technologies and the sharing of information they collect with third parties.
You can reject marketing cookies by pressing "Deny Optional," but we still use essential, performance, and functional cookies.
In addition, whether you "Accept All," Deny Optional," click the X or otherwise continue to use the site, you accept our Privacy Policy and Terms of Service, revised from time to time.
You are being directed to ZacksTrade, a division of LBMZ Securities and licensed broker-dealer. ZacksTrade and Zacks.com are separate companies. The web link between the two companies is not a solicitation or offer to invest in a particular security or type of security. ZacksTrade does not endorse or adopt any particular investment strategy, any analyst opinion/rating/report or any approach to evaluating individual securities.
If you wish to go to ZacksTrade, click OK. If you do not, click Cancel.
Airline stocks have long been among the market’s most cyclical and, at times, most rewarding investments.
The industry includes U.S. carriers, low-cost operators, international carriers and cargo-focused airlines.
Top airline stocks to buy now include Southwest Airlines, Allegiant Travel and LATAM.
Airline stocks have long been among the market’s most cyclical and, at times, most rewarding investments. When economic growth accelerates, leisure and business travel tend to follow, lifting passenger volumes and improving pricing power. As global travel patterns normalize and international routes expand, many investors are revisiting the sector in search of durable opportunities.
The airline industry spans a wide range of business models. It includes major U.S. network carriers, ultra-low-cost operators built around price leadership, international flag carriers, and cargo-focused airlines tied to global trade flows. Each group carries its own mix of risks and potential returns. Understanding those differences is essential before committing capital.
Are airline stocks a good investment?
Airlines can generate meaningful gains during economic expansions, when high load factors and stronger fare pricing support revenue growth. Large carriers such as Delta Air Lines and United Airlines Holdings have historically benefited from rising passenger demand, particularly in premium and long-haul segments.
At the same time, airlines remain capital-intensive businesses that operate on relatively thin margins. Fuel costs are volatile, labor contracts can pressure expenses, and demand is closely linked to broader economic conditions. These dynamics make airline stocks better suited for investors who can tolerate cyclical swings rather than those seeking defensive stability.
In short, airline stocks can be compelling during demand upcycles, but they are rarely considered safe havens.
Below, we examine and rank leading airline stocks using a blend of Zacks Rank signals, Style Scores, and key fundamental metrics to help identify companies that may offer attractive long-term potential.
This is our short term rating system that serves as a timeliness indicator for stocks over the next 1 to 3 months. How good is it? See rankings and related performance below.
The Zacks Industry Rank assigns a rating to each of the 265 X (Expanded) Industries based on their average Zacks Rank.
An industry with a larger percentage of Zacks Rank #1's and #2's will have a better average Zacks Rank than one with a larger percentage of Zacks Rank #4's and #5's.
The industry with the best average Zacks Rank would be considered the top industry (1 out of 265), which would place it in the top 1% of Zacks Ranked Industries. The industry with the worst average Zacks Rank (265 out of 265) would place in the bottom 1%.
The Zacks Sector Rank assigns a rating to each of the 16 Sectors based on their average Zacks Rank.
A sector with a larger percentage of Zacks Rank #1's and #2's will have a better average Zacks Rank than one with a larger percentage of Zacks Rank #4's and #5's.
The sector with the best average Zacks Rank would be considered the top sector (1 out of 16), which would place it in the top 1% of Zacks Ranked Sectors. The sector with the worst average Zacks Rank (16 out of 16) would place in the bottom 1%.
The Style Scores are a complementary set of indicators to use alongside the Zacks Rank. It allows the user to better focus on the stocks that are the best fit for his or her personal trading style.
The scores are based on the trading styles of Value, Growth, and Momentum. There's also a VGM Score ('V' for Value, 'G' for Growth and 'M' for Momentum), which combines the weighted average of the individual style scores into one score.
Value ScoreA
Growth ScoreA
Momentum ScoreA
VGM ScoreA
Within each Score, stocks are graded into five groups: A, B, C, D and F. As you might remember from your school days, an A, is better than a B; a B is better than a C; a C is better than a D; and a D is better than an F.
As an investor, you want to buy stocks with the highest probability of success. That means you want to buy stocks with a Zacks Rank #1 or #2, Strong Buy or Buy, which also has a Score of an A or a B in your personal trading style.
Zacks Earnings ESP (Expected Surprise Prediction) looks to find companies that have recently seen positive earnings estimate revision activity. The idea is that more recent information is, generally speaking, more accurate and can be a better predictor of the future, which can give investors an advantage in earnings season.
The technique has proven to be very useful for finding positive surprises. In fact, when combining a Zacks Rank #3 or better and a positive Earnings ESP, stocks produced a positive surprise 70% of the time, while they also saw 28.3% annual returns on average, according to our 10 year backtest.
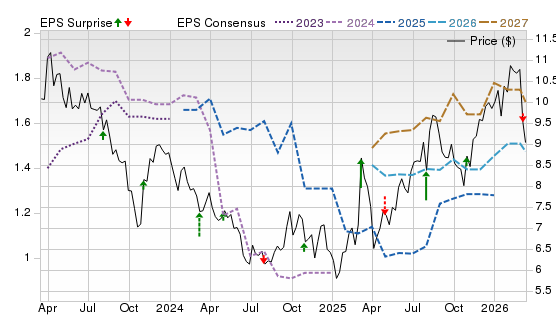
Allegiant Travel runs a U.S. ultra-low-cost airline focused on leisure routes, giving it high exposure to discretionary travel. In Q4 2025, the company delivered record fourth-quarter airline revenue and a 12.9% adjusted airline-only operating margin as operations improved and costs were better contained. The Sunseeker Resort sale will allow it to focus more on its core airline business and improve capital flexibility.
Potential Risks
Leisure yields can swing fast, and guidance can be derailed by fuel spikes, wage inflation, aircraft delivery or maintenance constraints, and disruptions. A fare war in overlapping vacation markets would squeeze unit revenue and valuation.
Forecast
A Zacks Rank #1 (Strong Buy), with a Score of A for Value and a D for Momentum signals improving revisions even as price action remains choppy. The company’s Price, Consensus & EPS Surprise chart shows the 2026–2027 consensus trend is higher, and surprises are mixed.
This is our short term rating system that serves as a timeliness indicator for stocks over the next 1 to 3 months. How good is it? See rankings and related performance below.
The Zacks Industry Rank assigns a rating to each of the 265 X (Expanded) Industries based on their average Zacks Rank.
An industry with a larger percentage of Zacks Rank #1's and #2's will have a better average Zacks Rank than one with a larger percentage of Zacks Rank #4's and #5's.
The industry with the best average Zacks Rank would be considered the top industry (1 out of 265), which would place it in the top 1% of Zacks Ranked Industries. The industry with the worst average Zacks Rank (265 out of 265) would place in the bottom 1%.
The Zacks Sector Rank assigns a rating to each of the 16 Sectors based on their average Zacks Rank.
A sector with a larger percentage of Zacks Rank #1's and #2's will have a better average Zacks Rank than one with a larger percentage of Zacks Rank #4's and #5's.
The sector with the best average Zacks Rank would be considered the top sector (1 out of 16), which would place it in the top 1% of Zacks Ranked Sectors. The sector with the worst average Zacks Rank (16 out of 16) would place in the bottom 1%.
The Style Scores are a complementary set of indicators to use alongside the Zacks Rank. It allows the user to better focus on the stocks that are the best fit for his or her personal trading style.
The scores are based on the trading styles of Value, Growth, and Momentum. There's also a VGM Score ('V' for Value, 'G' for Growth and 'M' for Momentum), which combines the weighted average of the individual style scores into one score.
Value ScoreA
Growth ScoreA
Momentum ScoreA
VGM ScoreA
Within each Score, stocks are graded into five groups: A, B, C, D and F. As you might remember from your school days, an A, is better than a B; a B is better than a C; a C is better than a D; and a D is better than an F.
As an investor, you want to buy stocks with the highest probability of success. That means you want to buy stocks with a Zacks Rank #1 or #2, Strong Buy or Buy, which also has a Score of an A or a B in your personal trading style.
Zacks Earnings ESP (Expected Surprise Prediction) looks to find companies that have recently seen positive earnings estimate revision activity. The idea is that more recent information is, generally speaking, more accurate and can be a better predictor of the future, which can give investors an advantage in earnings season.
The technique has proven to be very useful for finding positive surprises. In fact, when combining a Zacks Rank #3 or better and a positive Earnings ESP, stocks produced a positive surprise 70% of the time, while they also saw 28.3% annual returns on average, according to our 10 year backtest.
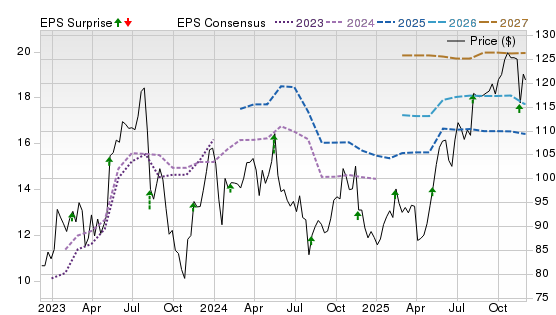
International Consolidated Airlines Group owns British Airways, Iberia, Aer Lingus, and Vueling, giving it heavy exposure to transatlantic and European travel. The company achieved record 2025 results, backed by resilient passenger demand, with operating profit increasing to more than €5 billion. Its sound liquidity position supports its shareholder-friendly policies, in the form of dividends and a share repurchase plan.
Potential Risks
Transatlantic pricing can soften fast if competitors add seats, and IAG is sensitive to Heathrow disruption, labor talks, and euro/sterling moves. Jet fuel spikes or geopolitical shocks can quickly compress margins and derail cash-return plans.
Forecast
A Zacks Rank #2 (Buy) paired with an A Value score points to supportive estimate revisions at a reasonable valuation, even with a D Growth and a C Momentum. The company’s chart shows 2026–2027 EPS estimates stepping higher and a recent run of positive surprises.
This is our short term rating system that serves as a timeliness indicator for stocks over the next 1 to 3 months. How good is it? See rankings and related performance below.
The Zacks Industry Rank assigns a rating to each of the 265 X (Expanded) Industries based on their average Zacks Rank.
An industry with a larger percentage of Zacks Rank #1's and #2's will have a better average Zacks Rank than one with a larger percentage of Zacks Rank #4's and #5's.
The industry with the best average Zacks Rank would be considered the top industry (1 out of 265), which would place it in the top 1% of Zacks Ranked Industries. The industry with the worst average Zacks Rank (265 out of 265) would place in the bottom 1%.
The Zacks Sector Rank assigns a rating to each of the 16 Sectors based on their average Zacks Rank.
A sector with a larger percentage of Zacks Rank #1's and #2's will have a better average Zacks Rank than one with a larger percentage of Zacks Rank #4's and #5's.
The sector with the best average Zacks Rank would be considered the top sector (1 out of 16), which would place it in the top 1% of Zacks Ranked Sectors. The sector with the worst average Zacks Rank (16 out of 16) would place in the bottom 1%.
The Style Scores are a complementary set of indicators to use alongside the Zacks Rank. It allows the user to better focus on the stocks that are the best fit for his or her personal trading style.
The scores are based on the trading styles of Value, Growth, and Momentum. There's also a VGM Score ('V' for Value, 'G' for Growth and 'M' for Momentum), which combines the weighted average of the individual style scores into one score.
Value ScoreA
Growth ScoreA
Momentum ScoreA
VGM ScoreA
Within each Score, stocks are graded into five groups: A, B, C, D and F. As you might remember from your school days, an A, is better than a B; a B is better than a C; a C is better than a D; and a D is better than an F.
As an investor, you want to buy stocks with the highest probability of success. That means you want to buy stocks with a Zacks Rank #1 or #2, Strong Buy or Buy, which also has a Score of an A or a B in your personal trading style.
Zacks Earnings ESP (Expected Surprise Prediction) looks to find companies that have recently seen positive earnings estimate revision activity. The idea is that more recent information is, generally speaking, more accurate and can be a better predictor of the future, which can give investors an advantage in earnings season.
The technique has proven to be very useful for finding positive surprises. In fact, when combining a Zacks Rank #3 or better and a positive Earnings ESP, stocks produced a positive surprise 70% of the time, while they also saw 28.3% annual returns on average, according to our 10 year backtest.
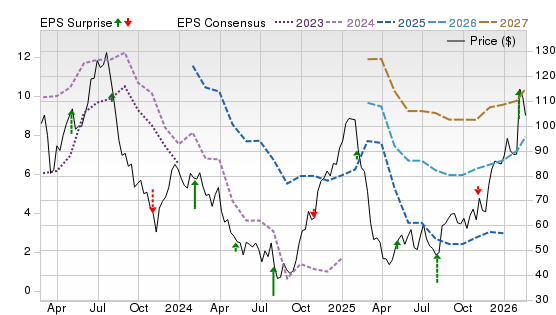
Corporación América Airports operates airports across Latin America and Europe, giving it airline exposure through passenger volumes and aeronautical and commercial fees. The company’s footprint spans more than 50 airports in markets like Argentina, Italy, Brazil, Ecuador, and Armenia, providing a blend of emerging-market rebound potential and developed-market stability. Its solid liquidity position adds to its strength.
Potential Risks
Airport operators face regulatory and concession-renewal risk, and CAAP’s results can be volatile as Argentina’s inflation accounting and currency fluctuations can mask underlying trends. A regional demand slowdown, higher rates, or execution slippage on capex and service levels could pressure valuation.
Forecast
A Zacks Rank #2 with Scores of A for Growth and B for Value suggests a supportive estimate direction. The chart shows the 2026–2027 EPS consensus stair-stepping higher, but the most recent surprises skew to a few misses even as the stock trends up.
This is our short term rating system that serves as a timeliness indicator for stocks over the next 1 to 3 months. How good is it? See rankings and related performance below.
The Zacks Industry Rank assigns a rating to each of the 265 X (Expanded) Industries based on their average Zacks Rank.
An industry with a larger percentage of Zacks Rank #1's and #2's will have a better average Zacks Rank than one with a larger percentage of Zacks Rank #4's and #5's.
The industry with the best average Zacks Rank would be considered the top industry (1 out of 265), which would place it in the top 1% of Zacks Ranked Industries. The industry with the worst average Zacks Rank (265 out of 265) would place in the bottom 1%.
The Zacks Sector Rank assigns a rating to each of the 16 Sectors based on their average Zacks Rank.
A sector with a larger percentage of Zacks Rank #1's and #2's will have a better average Zacks Rank than one with a larger percentage of Zacks Rank #4's and #5's.
The sector with the best average Zacks Rank would be considered the top sector (1 out of 16), which would place it in the top 1% of Zacks Ranked Sectors. The sector with the worst average Zacks Rank (16 out of 16) would place in the bottom 1%.
The Style Scores are a complementary set of indicators to use alongside the Zacks Rank. It allows the user to better focus on the stocks that are the best fit for his or her personal trading style.
The scores are based on the trading styles of Value, Growth, and Momentum. There's also a VGM Score ('V' for Value, 'G' for Growth and 'M' for Momentum), which combines the weighted average of the individual style scores into one score.
Value ScoreA
Growth ScoreA
Momentum ScoreA
VGM ScoreA
Within each Score, stocks are graded into five groups: A, B, C, D and F. As you might remember from your school days, an A, is better than a B; a B is better than a C; a C is better than a D; and a D is better than an F.
As an investor, you want to buy stocks with the highest probability of success. That means you want to buy stocks with a Zacks Rank #1 or #2, Strong Buy or Buy, which also has a Score of an A or a B in your personal trading style.
Zacks Earnings ESP (Expected Surprise Prediction) looks to find companies that have recently seen positive earnings estimate revision activity. The idea is that more recent information is, generally speaking, more accurate and can be a better predictor of the future, which can give investors an advantage in earnings season.
The technique has proven to be very useful for finding positive surprises. In fact, when combining a Zacks Rank #3 or better and a positive Earnings ESP, stocks produced a positive surprise 70% of the time, while they also saw 28.3% annual returns on average, according to our 10 year backtest.
Deutsche Lufthansa is an airline group with passenger brands and air cargo, giving it broad exposure to European and long-haul travel. In 2025, Lufthansa generated its highest revenue and guided for further earnings improvement in 2026. The results were supported by higher passenger volumes, stronger ancillary sales, and better fuel efficiency from newer aircraft, while cargo provides some diversification.
Potential Risks
The carrier is highly sensitive to jet-fuel prices and geopolitics, and it has warned that an intensifying Middle East conflict could disrupt operations and oil markets. Labor talks, airport/ATC disruption, aircraft delivery delays, and low-cost competition can quickly squeeze margins.
Forecast
A Zacks Rank #2 with a score of A for Value and D for Momentum suggests the valuation is attractive, but sentiment is fragile. The company’s chart shows 2026–2027 EPS consensus stepping up, with mixed earnings surprises.
This is our short term rating system that serves as a timeliness indicator for stocks over the next 1 to 3 months. How good is it? See rankings and related performance below.
The Zacks Industry Rank assigns a rating to each of the 265 X (Expanded) Industries based on their average Zacks Rank.
An industry with a larger percentage of Zacks Rank #1's and #2's will have a better average Zacks Rank than one with a larger percentage of Zacks Rank #4's and #5's.
The industry with the best average Zacks Rank would be considered the top industry (1 out of 265), which would place it in the top 1% of Zacks Ranked Industries. The industry with the worst average Zacks Rank (265 out of 265) would place in the bottom 1%.
The Zacks Sector Rank assigns a rating to each of the 16 Sectors based on their average Zacks Rank.
A sector with a larger percentage of Zacks Rank #1's and #2's will have a better average Zacks Rank than one with a larger percentage of Zacks Rank #4's and #5's.
The sector with the best average Zacks Rank would be considered the top sector (1 out of 16), which would place it in the top 1% of Zacks Ranked Sectors. The sector with the worst average Zacks Rank (16 out of 16) would place in the bottom 1%.
The Style Scores are a complementary set of indicators to use alongside the Zacks Rank. It allows the user to better focus on the stocks that are the best fit for his or her personal trading style.
The scores are based on the trading styles of Value, Growth, and Momentum. There's also a VGM Score ('V' for Value, 'G' for Growth and 'M' for Momentum), which combines the weighted average of the individual style scores into one score.
Value ScoreA
Growth ScoreA
Momentum ScoreA
VGM ScoreA
Within each Score, stocks are graded into five groups: A, B, C, D and F. As you might remember from your school days, an A, is better than a B; a B is better than a C; a C is better than a D; and a D is better than an F.
As an investor, you want to buy stocks with the highest probability of success. That means you want to buy stocks with a Zacks Rank #1 or #2, Strong Buy or Buy, which also has a Score of an A or a B in your personal trading style.
Zacks Earnings ESP (Expected Surprise Prediction) looks to find companies that have recently seen positive earnings estimate revision activity. The idea is that more recent information is, generally speaking, more accurate and can be a better predictor of the future, which can give investors an advantage in earnings season.
The technique has proven to be very useful for finding positive surprises. In fact, when combining a Zacks Rank #3 or better and a positive Earnings ESP, stocks produced a positive surprise 70% of the time, while they also saw 28.3% annual returns on average, according to our 10 year backtest.
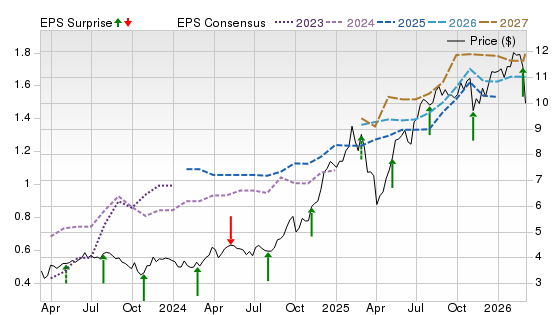
Copa Holdings runs Copa Airlines and connects the Americas through its Panama City hub, giving it exposure to Latin American travel flows. In Q4 2025, the company’s net profit rose to $172.6 million on 9.9% capacity growth, while a 21.8% operating margin and 89% on-time performance underscored execution. Copa ended the quarter with about $1.6 billion of liquidity and low leverage, supporting fleet additions and dividends.
Potential Risks
RASM was flat year over year, so fare pressure, fuel spikes, or currency volatility could squeeze margins. Higher maintenance spending or aircraft availability problems can also disrupt growth.
Forecast
A Zacks Rank #2 with Scores of A for Value, and B for Growth and Momentum suggests constructive estimate momentum. The chart shows EPS consensus rising into 2026–2027 and a long stretch of beats with occasional misses, a pattern that can keep revisions drifting higher.
The Zacks Rank is a proprietary stock-rating model that uses trends in earnings estimate revisions and earnings-per-share (EPS) surprises to classify stocks into five groups: #1 (Strong Buy), #2 (Buy), #3 (Hold), #4 (Sell) and #5 (Strong Sell). The Zacks Rank is calculated through four primary factors related to earnings estimates: analysts' consensus on earnings estimate revisions, the magnitude of revision change, the upside potential and estimate surprise (or the degree in which earnings per share deviated from the previous quarter).
Zacks builds the data from 3,000 analysts at over 150 different brokerage firms. The average yearly gain for Zacks Rank #1 (Strong Buy) stocks is +23.62% per year from January, 1988, through June 2, 2025.
Selections for Best Airline Stocks are based on the current top ranking stocks based on Zacks Indicator Score, Style Scores and fundamentals. All stocks have a daily trading volume of at least 100,000 shares and has a stock price of at least $5. All information is current as of market open, March 13, 2026.
General Questions About Airline Stocks
What are the benefits of buying airline stocks?
Exposure to global travel growth.
Operating leverage during economic expansions.
Pricing power during peak travel seasons.
Potential turnaround opportunities after downturns.
Consolidated U.S. industry with limited major competitors.
For example, legacy carriers like American Airlines Group (AAL) and United Airlines Holdings (UAL) control extensive route networks and benefit from international travel rebounds.
Low-cost carriers such as Southwest Airlines (LUV) and Spirit Airlines (SAVE) offer leaner cost structures that can outperform during certain demand cycles.
What are the risks of buying airline stocks?
High fuel-price exposure.
Sensitivity to recessions.
Heavy debt loads.
Labor and union cost pressures.
Weather and operational disruptions.
Geopolitical events impacting travel demand.
Airlines often carry substantial debt because aircraft fleets require significant capital investment. That leverage magnifies both gains and losses.
Airline Stocks vs Airline ETFs
If you prefer diversification, airline-focused ETFs may offer broader exposure than a single stock.
For example, the U.S. Global Jets ETF (JETS) holds major U.S. airlines along with international carriers and aircraft manufacturers.
Single stocks may offer higher upside if you pick a top performer, but ETFs reduce company-specific risk.
Do airline stocks pay dividends?
Some airlines historically paid dividends, but payouts were largely suspended during the pandemic. While certain carriers are rebuilding balance sheets, dividends are not yet widespread across the sector.
Investors typically buy airline stocks for capital appreciation rather than income.
How to Select Fundamentally Strong Airline Stocks
Choosing the best airline stocks requires analyzing more than passenger growth headlines.
Key fundamentals to evaluate include:
Debt-to-equity ratio.
Free cash flow generation.
Fuel-hedging strategy.
Cost per available seat mile (CASM).
Revenue per available seat mile (RASM).
Load factor trends.
Fleet age and efficiency.
Carriers investing in fuel-efficient aircraft may have a competitive edge when oil prices rise.
How can I analyze an airline stock’s potential?
Start by reviewing:
Revenue growth trends (domestic vs international mix).
Profit margins relative to peers.
Capacity expansion plans.
Management guidance.
Analyst consensus estimates.
Exposure to premium travel vs leisure travel.
For example, Alaska Air Group (ALK) has historically focused on operational reliability and West Coast routes, while JetBlue Airways (JBLU) emphasizes value-oriented routes and customer amenities.
International exposure can also diversify revenue streams. European carrier Ryanair Holdings (RYAAY) is known for its ultra-low-cost model and cost discipline.
Market Condition Questions About Airline Stocks
Are airline stocks recovering?
Airline stocks have rebounded alongside travel demand recovery, especially in leisure and international routes. Profitability depends on maintaining pricing strength while managing fuel and labor costs.
Corporate travel trends remain a key variable, as business travelers typically generate higher margins.
Are airline stocks a good long-term investment?
Long term, airlines tend to grow in line with GDP and global travel trends. However, returns can be uneven due to industry cyclicality.
Investors seeking steady compounding may prefer airlines with stronger balance sheets and diversified route networks.
Should I buy airline stocks during a recession?
Airline stocks often decline sharply during recessions because travel demand falls. However, downturns can create attractive entry points for long-term investors willing to tolerate volatility.
Historically, the best returns often came from buying during periods of pessimism — but timing requires patience and risk tolerance.
Risk and Volatility of Airline Stocks
Why are airline stocks so volatile?
Airlines operate with:
High fixed costs.
Thin margins.
Exposure to commodity prices.
Economic sensitivity.
Small changes in ticket pricing or fuel costs can dramatically impact earnings.
Are airline stocks risky?
Yes — compared to many other sectors. They are considered cyclical and economically sensitive investments.
However, risk varies by business model. Ultra-low-cost carriers may be more resilient during budget-conscious travel periods, while premium-focused airlines may perform better in strong economies.
What are the biggest risks of investing in airline stocks?
Oil price spikes.
Economic downturns.
Excess capacity.
Competitive pricing wars.
Labor disputes.
Regulatory changes.
Why do airline stocks drop when oil prices rise?
Fuel is one of the largest operating expenses for airlines. When oil prices rise, jet fuel costs increase, squeezing profit margins unless ticket prices rise fast enough to offset the expense.
Airlines with fuel-hedging programs or more efficient fleets may soften the impact.
How do recessions affect airline stocks?
Recessions reduce discretionary spending and business travel. Load factors decline, pricing weakens, and airlines may reduce capacity.
Because of high fixed costs, even modest declines in demand can lead to outsized earnings pressure.
How do you invest in airline stocks?
You can invest through:
Individual airline stocks.
Airline-focused ETFs.
Broader transportation or industrial ETFs.
Mutual funds with airline exposure.
Investors should consider risk tolerance, time horizon, and portfolio diversification before allocating capital.
Is it better to buy one airline stock or diversify?
Owning one airline stock can offer higher upside if that company outperforms. However, diversification reduces company-specific risks like operational disruptions or management missteps.
For example:
A portfolio holding Delta Air Lines (DAL) for premium exposure.
Southwest Airlines (LUV) for domestic low-cost exposure.
And Ryanair Holdings (RYAAY) for international diversification.
Alternatively, the U.S. Global Jets ETF (JETS) provides one-click exposure to the broader airline ecosystem.
Final Thoughts
The best airline stocks can deliver powerful gains when travel demand is strong and capacity is disciplined. But they are inherently volatile, sensitive to oil prices, and heavily tied to economic cycles.
For investors comfortable with cyclical swings, airline stocks may offer tactical opportunities — especially during industry recoveries or economic rebounds. For others, diversified exposure through ETFs may provide a smoother ride.
As always, balance growth potential with risk management when investing in this high-flying sector.


 Buy
Buy 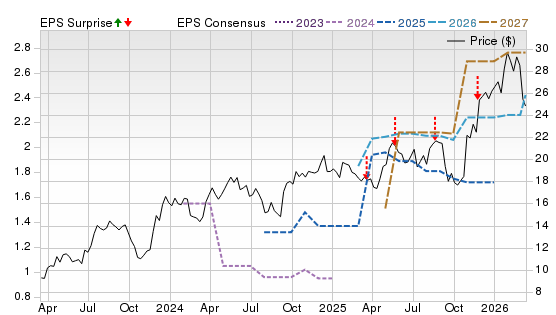
 Buy
Buy