We use cookies to understand how you use our site and to improve your experience.
This includes personalizing content and advertising.
By pressing "Accept All" or closing out of this banner, you consent to the use of all cookies and similar technologies and the sharing of information they collect with third parties.
You can reject marketing cookies by pressing "Deny Optional," but we still use essential, performance, and functional cookies.
In addition, whether you "Accept All," Deny Optional," click the X or otherwise continue to use the site, you accept our Privacy Policy and Terms of Service, revised from time to time.
You are being directed to ZacksTrade, a division of LBMZ Securities and licensed broker-dealer. ZacksTrade and Zacks.com are separate companies. The web link between the two companies is not a solicitation or offer to invest in a particular security or type of security. ZacksTrade does not endorse or adopt any particular investment strategy, any analyst opinion/rating/report or any approach to evaluating individual securities.
If you wish to go to ZacksTrade, click OK. If you do not, click Cancel.
Nuclear energy has come roaring back as countries and corporations seek reliable, low-carbon power options.
The AI explosion and the data centers required are a big part of nuclear energy renaissance.
Top nuclear energy stocks right now include NextEra Energy, GE Vernova and Energy Fuels.
Nuclear energy is stepping back into the spotlight as governments and corporations look for reliable, low-carbon power that can run around the clock. From life-extending existing reactors to backing next-generation technologies like small modular reactors (SMRs), policy support is strengthening across the globe. For investors, that creates opportunities spanning established utilities, advanced reactor developers, and specialized nuclear technology firms.
Is Now a Good Time to Invest in Nuclear Energy Stocks?
Several signals suggest the industry may be at an inflection point. Countries are approving new reactor projects, extending operating licenses, and committing capital to SMR commercialization to support grid stability and decarbonization goals. At the same time, power-hungry customers such as AI data centers and large industrial users are locking in long-term nuclear supply contracts, improving visibility into future cash flows.
That said, nuclear investing rewards patience. Long development timelines, regulatory complexity, and project-execution risks mean results can vary widely from company to company.
Below, we analyze and rank the best nuclear stocks using a blend of Zacks Rank signals, Style Scores, and fundamentals to highlight compelling opportunities today. (To see a full list of nuclear energy stocks, visit our Nuclear Energy thematic stock screen).
This is our short term rating system that serves as a timeliness indicator for stocks over the next 1 to 3 months. How good is it? See rankings and related performance below.
The Zacks Industry Rank assigns a rating to each of the 265 X (Expanded) Industries based on their average Zacks Rank.
An industry with a larger percentage of Zacks Rank #1's and #2's will have a better average Zacks Rank than one with a larger percentage of Zacks Rank #4's and #5's.
The industry with the best average Zacks Rank would be considered the top industry (1 out of 265), which would place it in the top 1% of Zacks Ranked Industries. The industry with the worst average Zacks Rank (265 out of 265) would place in the bottom 1%.
The Zacks Sector Rank assigns a rating to each of the 16 Sectors based on their average Zacks Rank.
A sector with a larger percentage of Zacks Rank #1's and #2's will have a better average Zacks Rank than one with a larger percentage of Zacks Rank #4's and #5's.
The sector with the best average Zacks Rank would be considered the top sector (1 out of 16), which would place it in the top 1% of Zacks Ranked Sectors. The sector with the worst average Zacks Rank (16 out of 16) would place in the bottom 1%.
The Style Scores are a complementary set of indicators to use alongside the Zacks Rank. It allows the user to better focus on the stocks that are the best fit for his or her personal trading style.
The scores are based on the trading styles of Value, Growth, and Momentum. There's also a VGM Score ('V' for Value, 'G' for Growth and 'M' for Momentum), which combines the weighted average of the individual style scores into one score.
Value ScoreA
Growth ScoreA
Momentum ScoreA
VGM ScoreA
Within each Score, stocks are graded into five groups: A, B, C, D and F. As you might remember from your school days, an A, is better than a B; a B is better than a C; a C is better than a D; and a D is better than an F.
As an investor, you want to buy stocks with the highest probability of success. That means you want to buy stocks with a Zacks Rank #1 or #2, Strong Buy or Buy, which also has a Score of an A or a B in your personal trading style.
Zacks Earnings ESP (Expected Surprise Prediction) looks to find companies that have recently seen positive earnings estimate revision activity. The idea is that more recent information is, generally speaking, more accurate and can be a better predictor of the future, which can give investors an advantage in earnings season.
The technique has proven to be very useful for finding positive surprises. In fact, when combining a Zacks Rank #3 or better and a positive Earnings ESP, stocks produced a positive surprise 70% of the time, while they also saw 28.3% annual returns on average, according to our 10 year backtest.
NextEra Energy is a leading regulated utility and clean-energy developer with one of the largest power-generation portfolios in the United States. Its expanding regulated investment base, growing large-load opportunity tied to rising electricity demand and long-term contracted businesses are expected to support steady earnings growth. The company's nuclear fleet and diversified generation assets further strengthen its long-term growth prospects.
Potential Risks
Large capital commitments, regulatory approvals, integration and execution risks, rising interest rates, commodity-price volatility and weaker electricity demand could delay projects, pressure returns and limit long-term earnings growth.
Forecast
A Zacks Rank #2 (Buy) signals favorable earnings-revision momentum, but Value D and Growth F flag a demanding valuation and muted score-based growth appeal. Momentum A is the strongest counterweight. The chart shows price advancing above rising 2026 and 2027 consensus lines, estimates edging higher and a mixed surprise record, suggesting constructive sentiment without uniformly dependable beats.
This is our short term rating system that serves as a timeliness indicator for stocks over the next 1 to 3 months. How good is it? See rankings and related performance below.
The Zacks Industry Rank assigns a rating to each of the 265 X (Expanded) Industries based on their average Zacks Rank.
An industry with a larger percentage of Zacks Rank #1's and #2's will have a better average Zacks Rank than one with a larger percentage of Zacks Rank #4's and #5's.
The industry with the best average Zacks Rank would be considered the top industry (1 out of 265), which would place it in the top 1% of Zacks Ranked Industries. The industry with the worst average Zacks Rank (265 out of 265) would place in the bottom 1%.
The Zacks Sector Rank assigns a rating to each of the 16 Sectors based on their average Zacks Rank.
A sector with a larger percentage of Zacks Rank #1's and #2's will have a better average Zacks Rank than one with a larger percentage of Zacks Rank #4's and #5's.
The sector with the best average Zacks Rank would be considered the top sector (1 out of 16), which would place it in the top 1% of Zacks Ranked Sectors. The sector with the worst average Zacks Rank (16 out of 16) would place in the bottom 1%.
The Style Scores are a complementary set of indicators to use alongside the Zacks Rank. It allows the user to better focus on the stocks that are the best fit for his or her personal trading style.
The scores are based on the trading styles of Value, Growth, and Momentum. There's also a VGM Score ('V' for Value, 'G' for Growth and 'M' for Momentum), which combines the weighted average of the individual style scores into one score.
Value ScoreA
Growth ScoreA
Momentum ScoreA
VGM ScoreA
Within each Score, stocks are graded into five groups: A, B, C, D and F. As you might remember from your school days, an A, is better than a B; a B is better than a C; a C is better than a D; and a D is better than an F.
As an investor, you want to buy stocks with the highest probability of success. That means you want to buy stocks with a Zacks Rank #1 or #2, Strong Buy or Buy, which also has a Score of an A or a B in your personal trading style.
Zacks Earnings ESP (Expected Surprise Prediction) looks to find companies that have recently seen positive earnings estimate revision activity. The idea is that more recent information is, generally speaking, more accurate and can be a better predictor of the future, which can give investors an advantage in earnings season.
The technique has proven to be very useful for finding positive surprises. In fact, when combining a Zacks Rank #3 or better and a positive Earnings ESP, stocks produced a positive surprise 70% of the time, while they also saw 28.3% annual returns on average, according to our 10 year backtest.
Energy Fuels is a U.S.-based critical-materials producer with uranium mining and processing assets. Production is expected to rise toward 1.5–2.5 million pounds in 2026, supported by Pinyon Plain, La Sal and White Mesa. Six utility contracts, inventory flexibility and a development pipeline with nearly 70 million pounds of resources could strengthen nuclear-fuel supply and revenue visibility.
Potential Risks
Uranium prices, permitting delays and operating setbacks could disrupt planned growth. Major development projects require approvals, financing and execution, while contract and spot-market exposure may increase earnings volatility.
Forecast
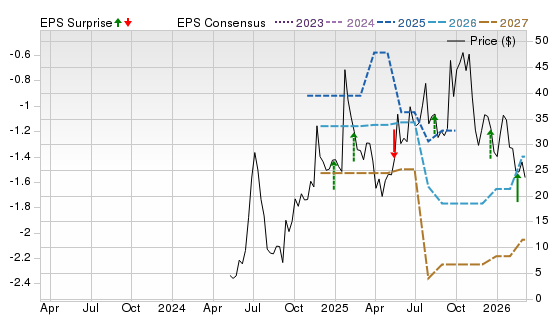
A Zacks Rank #2 indicates positive estimate revisions, yet F scores for Value and Momentum and a D for Growth provide limited support from the Style Scores. The chart depicts an explosive price rise followed by sharp reversals. The 2026 estimates are volatile, 2027 expectations have softened and earnings surprises alternate widely. That pattern favors tactical upside from uranium catalysts.
This is our short term rating system that serves as a timeliness indicator for stocks over the next 1 to 3 months. How good is it? See rankings and related performance below.
The Zacks Industry Rank assigns a rating to each of the 265 X (Expanded) Industries based on their average Zacks Rank.
An industry with a larger percentage of Zacks Rank #1's and #2's will have a better average Zacks Rank than one with a larger percentage of Zacks Rank #4's and #5's.
The industry with the best average Zacks Rank would be considered the top industry (1 out of 265), which would place it in the top 1% of Zacks Ranked Industries. The industry with the worst average Zacks Rank (265 out of 265) would place in the bottom 1%.
The Zacks Sector Rank assigns a rating to each of the 16 Sectors based on their average Zacks Rank.
A sector with a larger percentage of Zacks Rank #1's and #2's will have a better average Zacks Rank than one with a larger percentage of Zacks Rank #4's and #5's.
The sector with the best average Zacks Rank would be considered the top sector (1 out of 16), which would place it in the top 1% of Zacks Ranked Sectors. The sector with the worst average Zacks Rank (16 out of 16) would place in the bottom 1%.
The Style Scores are a complementary set of indicators to use alongside the Zacks Rank. It allows the user to better focus on the stocks that are the best fit for his or her personal trading style.
The scores are based on the trading styles of Value, Growth, and Momentum. There's also a VGM Score ('V' for Value, 'G' for Growth and 'M' for Momentum), which combines the weighted average of the individual style scores into one score.
Value ScoreA
Growth ScoreA
Momentum ScoreA
VGM ScoreA
Within each Score, stocks are graded into five groups: A, B, C, D and F. As you might remember from your school days, an A, is better than a B; a B is better than a C; a C is better than a D; and a D is better than an F.
As an investor, you want to buy stocks with the highest probability of success. That means you want to buy stocks with a Zacks Rank #1 or #2, Strong Buy or Buy, which also has a Score of an A or a B in your personal trading style.
Zacks Earnings ESP (Expected Surprise Prediction) looks to find companies that have recently seen positive earnings estimate revision activity. The idea is that more recent information is, generally speaking, more accurate and can be a better predictor of the future, which can give investors an advantage in earnings season.
The technique has proven to be very useful for finding positive surprises. In fact, when combining a Zacks Rank #3 or better and a positive Earnings ESP, stocks produced a positive surprise 70% of the time, while they also saw 28.3% annual returns on average, according to our 10 year backtest.
GE Vernova is a power-equipment company with nuclear capabilities centered on GE Hitachi’s BWRX-300 small modular reactor. Construction progress in Canada, prospective deployments in the United States and Sweden, and follow-on units could expand its contracted base. A larger order book should support supply-chain investment, lower component costs and help nuclear become an important earnings contributor during the next decade.
Potential Risks
Early projects remain costly because the supporting supply chain is underdeveloped. Returns depend on securing sufficient contracts, reducing component costs and successfully navigating lengthy construction and regulatory timelines.
Forecast
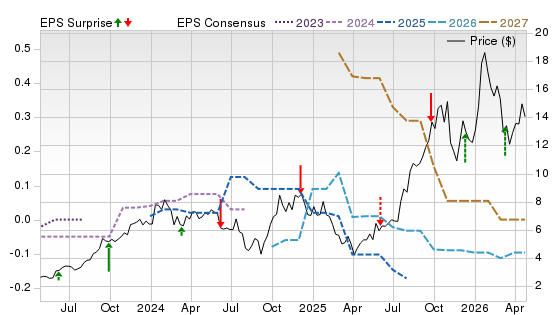
A Zacks Rank #2 points to favorable earnings revisions. Growth B is supportive, but Value F and Momentum D temper the signal. The chart shows a steep price advance, rising 2026 and 2027 consensus estimates and mostly positive recent surprises, although the latest volatility suggests expectations are elevated. Continued estimate upgrades could sustain leadership.
This is our short term rating system that serves as a timeliness indicator for stocks over the next 1 to 3 months. How good is it? See rankings and related performance below.
The Zacks Industry Rank assigns a rating to each of the 265 X (Expanded) Industries based on their average Zacks Rank.
An industry with a larger percentage of Zacks Rank #1's and #2's will have a better average Zacks Rank than one with a larger percentage of Zacks Rank #4's and #5's.
The industry with the best average Zacks Rank would be considered the top industry (1 out of 265), which would place it in the top 1% of Zacks Ranked Industries. The industry with the worst average Zacks Rank (265 out of 265) would place in the bottom 1%.
The Zacks Sector Rank assigns a rating to each of the 16 Sectors based on their average Zacks Rank.
A sector with a larger percentage of Zacks Rank #1's and #2's will have a better average Zacks Rank than one with a larger percentage of Zacks Rank #4's and #5's.
The sector with the best average Zacks Rank would be considered the top sector (1 out of 16), which would place it in the top 1% of Zacks Ranked Sectors. The sector with the worst average Zacks Rank (16 out of 16) would place in the bottom 1%.
The Style Scores are a complementary set of indicators to use alongside the Zacks Rank. It allows the user to better focus on the stocks that are the best fit for his or her personal trading style.
The scores are based on the trading styles of Value, Growth, and Momentum. There's also a VGM Score ('V' for Value, 'G' for Growth and 'M' for Momentum), which combines the weighted average of the individual style scores into one score.
Value ScoreA
Growth ScoreA
Momentum ScoreA
VGM ScoreA
Within each Score, stocks are graded into five groups: A, B, C, D and F. As you might remember from your school days, an A, is better than a B; a B is better than a C; a C is better than a D; and a D is better than an F.
As an investor, you want to buy stocks with the highest probability of success. That means you want to buy stocks with a Zacks Rank #1 or #2, Strong Buy or Buy, which also has a Score of an A or a B in your personal trading style.
Zacks Earnings ESP (Expected Surprise Prediction) looks to find companies that have recently seen positive earnings estimate revision activity. The idea is that more recent information is, generally speaking, more accurate and can be a better predictor of the future, which can give investors an advantage in earnings season.
The technique has proven to be very useful for finding positive surprises. In fact, when combining a Zacks Rank #3 or better and a positive Earnings ESP, stocks produced a positive surprise 70% of the time, while they also saw 28.3% annual returns on average, according to our 10 year backtest.
PG&E's long-term growth outlook includes continued nuclear generation from Diablo Canyon alongside an expanding regulated infrastructure base. The NRC license extension should support continued operations, while the company’s planned capital program, rising rate base and targeted operating-cost reductions could strengthen regulated earnings visibility. Data-center load growth and financing plans that avoid common-equity issuance may further support long-term cash generation.
Potential Risks
Regulatory outcomes and cost recovery remain major uncertainties. Heavy debt requirements, infrastructure execution and potential changes affecting nuclear operations could materially weaken financial performance.
Forecast
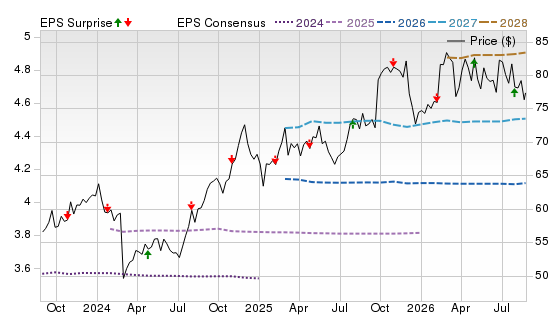
A Zacks Rank #2 signals favorable near-term earnings revisions, reinforced by Value A. Growth C is neutral and Momentum D is weaker. The chart shows the stock recovering unevenly while 2026 estimates trend modestly higher and 2027 consensus remains comparatively stable. Surprise markers are mixed rather than consistently positive, implying that valuation support and regulated growth matter more than beat-driven momentum.
This is our short term rating system that serves as a timeliness indicator for stocks over the next 1 to 3 months. How good is it? See rankings and related performance below.
The Zacks Industry Rank assigns a rating to each of the 265 X (Expanded) Industries based on their average Zacks Rank.
An industry with a larger percentage of Zacks Rank #1's and #2's will have a better average Zacks Rank than one with a larger percentage of Zacks Rank #4's and #5's.
The industry with the best average Zacks Rank would be considered the top industry (1 out of 265), which would place it in the top 1% of Zacks Ranked Industries. The industry with the worst average Zacks Rank (265 out of 265) would place in the bottom 1%.
The Zacks Sector Rank assigns a rating to each of the 16 Sectors based on their average Zacks Rank.
A sector with a larger percentage of Zacks Rank #1's and #2's will have a better average Zacks Rank than one with a larger percentage of Zacks Rank #4's and #5's.
The sector with the best average Zacks Rank would be considered the top sector (1 out of 16), which would place it in the top 1% of Zacks Ranked Sectors. The sector with the worst average Zacks Rank (16 out of 16) would place in the bottom 1%.
The Style Scores are a complementary set of indicators to use alongside the Zacks Rank. It allows the user to better focus on the stocks that are the best fit for his or her personal trading style.
The scores are based on the trading styles of Value, Growth, and Momentum. There's also a VGM Score ('V' for Value, 'G' for Growth and 'M' for Momentum), which combines the weighted average of the individual style scores into one score.
Value ScoreA
Growth ScoreA
Momentum ScoreA
VGM ScoreA
Within each Score, stocks are graded into five groups: A, B, C, D and F. As you might remember from your school days, an A, is better than a B; a B is better than a C; a C is better than a D; and a D is better than an F.
As an investor, you want to buy stocks with the highest probability of success. That means you want to buy stocks with a Zacks Rank #1 or #2, Strong Buy or Buy, which also has a Score of an A or a B in your personal trading style.
Zacks Earnings ESP (Expected Surprise Prediction) looks to find companies that have recently seen positive earnings estimate revision activity. The idea is that more recent information is, generally speaking, more accurate and can be a better predictor of the future, which can give investors an advantage in earnings season.
The technique has proven to be very useful for finding positive surprises. In fact, when combining a Zacks Rank #3 or better and a positive Earnings ESP, stocks produced a positive surprise 70% of the time, while they also saw 28.3% annual returns on average, according to our 10 year backtest.
Ameren is a regulated Midwest utility with nuclear exposure through the 1,194-megawatt Callaway Energy Center. Its $31.8 billion 2026 to 2030 investment plan, projected 10.6% rate-base CAGR and expected EPS growth near the upper end of 6% to 8% could support long-term returns. Rising Missouri demand and planned transmission expansion may strengthen system reliability and broaden future regulated investment opportunities across its service territory.
Potential Risks
Warmer weather already reduced Missouri retail sales, and higher interest expense offset part of quarterly progress. Regulatory lag and equity issuance could dilute returns from the investment program.
Forecast
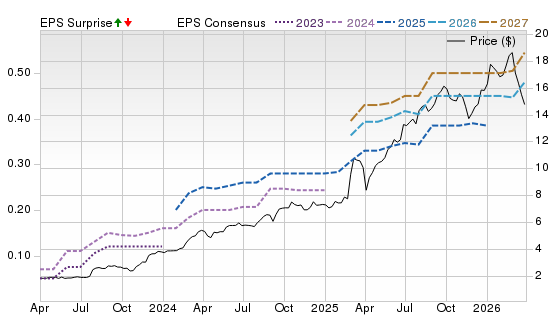
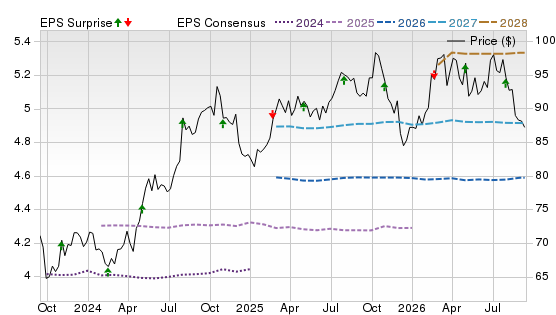
A Zacks Rank #2 indicates favorable earnings-revision trends. Momentum B is the strongest Style Score, while Value C is neutral and Growth D is less supportive. The chart shows a long-term price recovery followed by consolidation. The 2026 consensus has firmed, 2027 estimates are broadly steady and recent surprises skew positive but remain uneven.
The Zacks Rank is a proprietary stock-rating model that uses trends in earnings estimate revisions and earnings-per-share (EPS) surprises to classify stocks into five groups: #1 (Strong Buy), #2 (Buy), #3 (Hold), #4 (Sell) and #5 (Strong Sell). The Zacks Rank is calculated through four primary factors related to earnings estimates: analysts' consensus on earnings estimate revisions, the magnitude of revision change, the upside potential and estimate surprise (or the degree in which earnings per share deviated from the previous quarter).
Zacks builds the data from 3,000 analysts at over 150 different brokerage firms. The average yearly gain for Zacks Rank #1 (Strong Buy) stocks is +23.94% per year from January, 1988, through June 1, 2026.
Selections for Best Nuclear Energy Stocks are based on the current top ranking stocks based on Zacks Indicator Score, Style Scores and fundamentals. All information is current as of market open, July 13, 2026.
Learn More About Nuclear Energy Stocks
What Are Nuclear Energy Stocks?
Nuclear energy stocks represent ownership in publicly traded companies involved in nuclear power generation, reactor engineering, fuel manufacturing, and related services. These companies form part of the broader clean-energy transition while offering diversification away from fossil fuels.
What Are Some Examples of Nuclear Energy Stocks?
Best Nuclear Reactor Technology Stocks
NuScale Power (SMR - Free Report ) – Leading developer of SMR technology with NRC-certified designs that are scalable for diverse power needs.
Oklo Inc. (OKLO - Free Report) – Focused on compact fast reactors and advanced fuel solutions that may serve both grid and industrial customers.
Best Nuclear Energy Utility Stocks
Constellation Energy (CEG - Free Report) – Major U.S. utility with extensive nuclear generation assets and recent federal support to restart legacy reactors.
Dominion Energy (D - Free Report) – Diversified utility operating nuclear plants alongside renewables and other generation sources.
Best Small Modular Reactor (SMR) Stocks
NuScale Power (SMR) – First mover in NRC-approved SMR designs intended for global deployment.
NANO Nuclear Energy (NNE - Free Report) – Targeting the micro-reactor niche with portable reactor designs for specialized applications. .
What Are the Benefits of Buying Nuclear Energy Stocks?
Access to baseload power generation supporting grid stability.
Exposure to long-term structural growth in clean energy demand.
Potential dividends from established utilities.
Diversification from traditional fossil fuel exposures.
What Are the Risks of Buying Nuclear Energy Stocks?
High capital intensity with long project timelines.
Regulatory and permitting uncertainties.
Public sentiment can affect policy and plant approvals.
Some technology stocks may not generate revenue for years.
Nuclear Energy Stocks vs Nuclear Energy ETFs
Investors seeking broader exposure with lower company-specific risk may prefer ETFs, which bundle multiple nuclear stocks — from uranium miners and utilities to reactor builders. Individual stocks can offer higher upside but come with greater volatility.
How Does Nuclear Energy Demand Affect Nuclear Stocks?
Strong demand for reliable electricity — especially from industrial users and data centers — typically increases utility earnings visibility and supports long-term contracts that benefit nuclear power producers.
Is Nuclear Energy Considered Clean Energy?
Nuclear power produces electricity with minimal greenhouse gas emissions during operation and is widely recognized in many clean energy frameworks, despite ongoing debates over waste management.
Are Nuclear Energy Stocks Good During Economic Uncertainty?
Utility-focused nuclear stocks often provide stable cash flows and dividends, acting as defensive assets in uncertain markets. Tech-heavy nuclear firms can be more cyclical and sensitive to investor sentiment.
Nuclear vs Uranium Stocks: What’s the Difference?
Nuclear energy stocks involve companies producing power or technology for reactors.
Uranium stocks focus on mining and commodity exposure to nuclear fuel prices.
Both benefit from overall nuclear sector growth, but they perform differently in response to market drivers.
Evaluating if Nuclear Energy Stocks Fit Your Investing Portfolio
How Does Uranium Price Affect Nuclear Energy Stocks?
Spikes in uranium pricing may increase fuel costs but can signal higher long-term nuclear demand, often bolstering related infrastructure investment.
Will Small Modular Reactors (SMRs) Increase Nuclear Stock Growth?
Commercial success for SMRs could open new market segments and accelerate capacity buildouts, potentially lifting shares of developers and their industrial partners.
How Will Government Policies Impact Nuclear Energy Companies?
Tax incentives, loan guarantees, and streamlined licensing improve nuclear project economics and can materially affect investor returns over the long term.
What Metrics Should I Evaluate When Picking Nuclear Stocks?
Assess balance-sheet strength, regulatory progress, contract pipelines, dividend history, and strategic partnerships that signal future growth potential.
How to Buy Nuclear Energy Stocks
How Do I Invest in Nuclear Energy Stocks?
You can buy shares of public companies through a brokerage platform. For stocks with higher volatility or lower liquidity, rigorous research is essential.
What Is the Easiest Way to Get Exposure to Nuclear Energy?
Nuclear-focused ETFs provide broad sector exposure without relying on the success of single companies.
Should I Buy Nuclear Stocks, Uranium Stocks, or Nuclear ETFs?
Choose based on your risk tolerance: individual nuclear stocks for targeted exposure, uranium stocks for commodity leverage, and ETFs for diversified sector participation.
Top Nuclear Energy ETFs to Invest In
VanEck Uranium+Nuclear ETF (NLR). Broad industry exposure across utilities, reactor tech, and fuel services.
Range Nuclear Renaissance ETF (NUKZ). Focused on companies positioned to benefit from the nuclear revival.
Managing Nuclear Energy Stocks
When Should I Sell Nuclear Energy Stocks?
Consider reducing positions after major overvaluation, project delays, or if fundamentals deteriorate relative to industry peers.
How Will Global Energy Transition Goals Affect My Nuclear Investments?
Global decarbonization targets and reliability concerns point to continued relevance for nuclear energy in balanced clean-energy portfolios.
Alternatives to Nuclear Energy Stocks
Are Nuclear Energy Stocks Too Risky?
Early-stage technology plays carry higher risk, but utilities with nuclear exposure tend to be more stable
Should I Invest in Renewable Energy Stocks Instead?
Renewables are expanding faster, but nuclear offers continuous baseload power, making it a complementary clean-energy asset.
Are Traditional Utility Stocks Safer Than Nuclear Stocks?
Traditional regulated utilities may be less volatile and provide dependable income, while nuclear stocks can offer greater thematic growth potential.