We use cookies to understand how you use our site and to improve your experience.
This includes personalizing content and advertising.
By pressing "Accept All" or closing out of this banner, you consent to the use of all cookies and similar technologies and the sharing of information they collect with third parties.
You can reject marketing cookies by pressing "Deny Optional," but we still use essential, performance, and functional cookies.
In addition, whether you "Accept All," Deny Optional," click the X or otherwise continue to use the site, you accept our Privacy Policy and Terms of Service, revised from time to time.
You are being directed to ZacksTrade, a division of LBMZ Securities and licensed broker-dealer. ZacksTrade and Zacks.com are separate companies. The web link between the two companies is not a solicitation or offer to invest in a particular security or type of security. ZacksTrade does not endorse or adopt any particular investment strategy, any analyst opinion/rating/report or any approach to evaluating individual securities.
If you wish to go to ZacksTrade, click OK. If you do not, click Cancel.
Global oil markets in 2026 are defined by a delicate balance of steady demand growth and geopolitical risk.
The sector performs best when prices are stable or gradually rising—not when volatility dominates.
Top oil stocks to buy today include Par Pacific, Suburban Propane and Imperial Oil.
Oil stocks remain a core segment of the global energy market, offering investors exposure to commodity-driven cash flows, dividends, and inflation-sensitive assets. While the sector is inherently cyclical, years of disciplined capital spending, balance-sheet repair, and shareholder-friendly policies have reshaped oil investing into a more cash-return-focused story than in past booms.
Oil Stock Market Overview and Forecast
Global oil markets in 2026 are defined by a delicate balance of steady demand growth from emerging economies, measured supply from OPEC+ producers, and persistent geopolitical risk in key exporting regions. International energy data and U.S. inventory trends continue to show seasonal stockpile swings, underscoring how sensitive crude prices remain to short-term supply disruptions and macroeconomic shifts.
At the same time, U.S. shale output, once synonymous with rapid expansion, is growing more selectively, with producers emphasizing capital discipline over volume growth. As a result, most analysts expect oil prices to remain range-bound rather than surge dramatically, a backdrop that tends to favor companies with low production costs, resilient balance sheets, and consistent free cash flow over growth-at-any-cost drillers.
Is now a good time to invest in oil stocks?
Historically, the sector performs best when prices are stable or gradually rising—not when volatility dominates headlines. In 2026, oil stocks increasingly appeal to income-oriented and value-focused investors seeking durable dividends, share repurchases, and prudent capital allocation.
Below, we analyze and rank the best oil stocks using a blend of Zacks Rank signals, Style Scores, and fundamental metrics to identify compelling opportunities in today’s market.
This is our short term rating system that serves as a timeliness indicator for stocks over the next 1 to 3 months. How good is it? See rankings and related performance below.
The Zacks Industry Rank assigns a rating to each of the 265 X (Expanded) Industries based on their average Zacks Rank.
An industry with a larger percentage of Zacks Rank #1's and #2's will have a better average Zacks Rank than one with a larger percentage of Zacks Rank #4's and #5's.
The industry with the best average Zacks Rank would be considered the top industry (1 out of 265), which would place it in the top 1% of Zacks Ranked Industries. The industry with the worst average Zacks Rank (265 out of 265) would place in the bottom 1%.
The Zacks Sector Rank assigns a rating to each of the 16 Sectors based on their average Zacks Rank.
A sector with a larger percentage of Zacks Rank #1's and #2's will have a better average Zacks Rank than one with a larger percentage of Zacks Rank #4's and #5's.
The sector with the best average Zacks Rank would be considered the top sector (1 out of 16), which would place it in the top 1% of Zacks Ranked Sectors. The sector with the worst average Zacks Rank (16 out of 16) would place in the bottom 1%.
The Style Scores are a complementary set of indicators to use alongside the Zacks Rank. It allows the user to better focus on the stocks that are the best fit for his or her personal trading style.
The scores are based on the trading styles of Value, Growth, and Momentum. There's also a VGM Score ('V' for Value, 'G' for Growth and 'M' for Momentum), which combines the weighted average of the individual style scores into one score.
Value ScoreA
Growth ScoreA
Momentum ScoreA
VGM ScoreA
Within each Score, stocks are graded into five groups: A, B, C, D and F. As you might remember from your school days, an A, is better than a B; a B is better than a C; a C is better than a D; and a D is better than an F.
As an investor, you want to buy stocks with the highest probability of success. That means you want to buy stocks with a Zacks Rank #1 or #2, Strong Buy or Buy, which also has a Score of an A or a B in your personal trading style.
Zacks Earnings ESP (Expected Surprise Prediction) looks to find companies that have recently seen positive earnings estimate revision activity. The idea is that more recent information is, generally speaking, more accurate and can be a better predictor of the future, which can give investors an advantage in earnings season.
The technique has proven to be very useful for finding positive surprises. In fact, when combining a Zacks Rank #3 or better and a positive Earnings ESP, stocks produced a positive surprise 70% of the time, while they also saw 28.3% annual returns on average, according to our 10 year backtest.
Par Pacific supplies conventional and renewable fuels across western U.S. markets through refining, logistics and retail operations. Its distillate-heavy output mix, integrated transportation assets and established store network could support margin capture across varied market conditions. Further upside may come from Hawaii Renewables and continued expansion of retail and logistics contributions to cash flow over time.
Potential Risks
Earnings remain exposed to refining spreads, crude differentials and outages, while renewable-project ramp-up, environmental compliance and term debt could pressure returns and liquidity during downturns.
Forecast
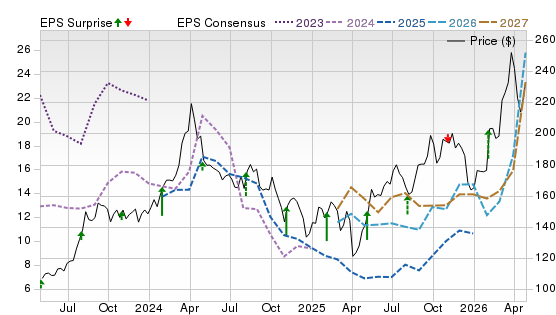
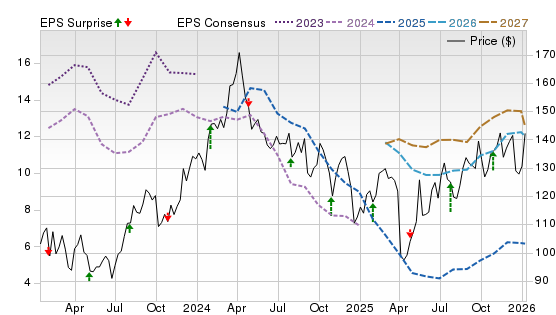
A Zacks Rank #1 (Strong Buy) signals favorable earnings-revision momentum, reinforced by Style Scores of A for Value and Momentum. The D Growth score tempers the case. The chart shows a powerful share-price advance and a sharp rebound in 2026-2028 consensus estimates after prior cuts. Earnings surprises have been mixed, including a recent miss, so estimate stability matters.
This is our short term rating system that serves as a timeliness indicator for stocks over the next 1 to 3 months. How good is it? See rankings and related performance below.
The Zacks Industry Rank assigns a rating to each of the 265 X (Expanded) Industries based on their average Zacks Rank.
An industry with a larger percentage of Zacks Rank #1's and #2's will have a better average Zacks Rank than one with a larger percentage of Zacks Rank #4's and #5's.
The industry with the best average Zacks Rank would be considered the top industry (1 out of 265), which would place it in the top 1% of Zacks Ranked Industries. The industry with the worst average Zacks Rank (265 out of 265) would place in the bottom 1%.
The Zacks Sector Rank assigns a rating to each of the 16 Sectors based on their average Zacks Rank.
A sector with a larger percentage of Zacks Rank #1's and #2's will have a better average Zacks Rank than one with a larger percentage of Zacks Rank #4's and #5's.
The sector with the best average Zacks Rank would be considered the top sector (1 out of 16), which would place it in the top 1% of Zacks Ranked Sectors. The sector with the worst average Zacks Rank (16 out of 16) would place in the bottom 1%.
The Style Scores are a complementary set of indicators to use alongside the Zacks Rank. It allows the user to better focus on the stocks that are the best fit for his or her personal trading style.
The scores are based on the trading styles of Value, Growth, and Momentum. There's also a VGM Score ('V' for Value, 'G' for Growth and 'M' for Momentum), which combines the weighted average of the individual style scores into one score.
Value ScoreA
Growth ScoreA
Momentum ScoreA
VGM ScoreA
Within each Score, stocks are graded into five groups: A, B, C, D and F. As you might remember from your school days, an A, is better than a B; a B is better than a C; a C is better than a D; and a D is better than an F.
As an investor, you want to buy stocks with the highest probability of success. That means you want to buy stocks with a Zacks Rank #1 or #2, Strong Buy or Buy, which also has a Score of an A or a B in your personal trading style.
Zacks Earnings ESP (Expected Surprise Prediction) looks to find companies that have recently seen positive earnings estimate revision activity. The idea is that more recent information is, generally speaking, more accurate and can be a better predictor of the future, which can give investors an advantage in earnings season.
The technique has proven to be very useful for finding positive surprises. In fact, when combining a Zacks Rank #3 or better and a positive Earnings ESP, stocks produced a positive surprise 70% of the time, while they also saw 28.3% annual returns on average, according to our 10 year backtest.
Suburban Propane is a nationwide propane distributor building a complementary renewable natural gas platform. Its hyperlocal operating model, customer-retention efforts and exposure to emerging propane uses in data centers, port equipment, agriculture and backup power could support demand. Scheduled RNG projects in New York and Ohio, added feedstock at Stanfield and production-tax-credit eligibility may broaden future earnings opportunities over time.
Potential Risks
Unpredictable temperatures can weaken propane demand, while commodity-price swings, project delays, higher operating costs and substantial leverage could further restrict cash flow and strategic flexibility.
Forecast
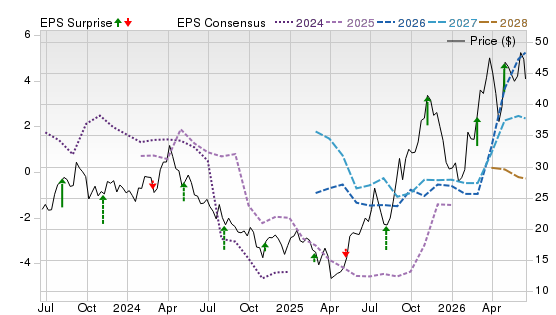
A Zacks Rank #1, plus Style Scores of A for Value and Momentum, suggests attractive revisions and trading strength, though the D Growth score signals limited expansion. The chart shows a volatile but rising price trend, with 2026 consensus estimates rebounding sharply and 2027 estimates stabilizing higher. The latest positive surprise supports the outlook, but sparse coverage increases forecast risk.
This is our short term rating system that serves as a timeliness indicator for stocks over the next 1 to 3 months. How good is it? See rankings and related performance below.
The Zacks Industry Rank assigns a rating to each of the 265 X (Expanded) Industries based on their average Zacks Rank.
An industry with a larger percentage of Zacks Rank #1's and #2's will have a better average Zacks Rank than one with a larger percentage of Zacks Rank #4's and #5's.
The industry with the best average Zacks Rank would be considered the top industry (1 out of 265), which would place it in the top 1% of Zacks Ranked Industries. The industry with the worst average Zacks Rank (265 out of 265) would place in the bottom 1%.
The Zacks Sector Rank assigns a rating to each of the 16 Sectors based on their average Zacks Rank.
A sector with a larger percentage of Zacks Rank #1's and #2's will have a better average Zacks Rank than one with a larger percentage of Zacks Rank #4's and #5's.
The sector with the best average Zacks Rank would be considered the top sector (1 out of 16), which would place it in the top 1% of Zacks Ranked Sectors. The sector with the worst average Zacks Rank (16 out of 16) would place in the bottom 1%.
The Style Scores are a complementary set of indicators to use alongside the Zacks Rank. It allows the user to better focus on the stocks that are the best fit for his or her personal trading style.
The scores are based on the trading styles of Value, Growth, and Momentum. There's also a VGM Score ('V' for Value, 'G' for Growth and 'M' for Momentum), which combines the weighted average of the individual style scores into one score.
Value ScoreA
Growth ScoreA
Momentum ScoreA
VGM ScoreA
Within each Score, stocks are graded into five groups: A, B, C, D and F. As you might remember from your school days, an A, is better than a B; a B is better than a C; a C is better than a D; and a D is better than an F.
As an investor, you want to buy stocks with the highest probability of success. That means you want to buy stocks with a Zacks Rank #1 or #2, Strong Buy or Buy, which also has a Score of an A or a B in your personal trading style.
Zacks Earnings ESP (Expected Surprise Prediction) looks to find companies that have recently seen positive earnings estimate revision activity. The idea is that more recent information is, generally speaking, more accurate and can be a better predictor of the future, which can give investors an advantage in earnings season.
The technique has proven to be very useful for finding positive surprises. In fact, when combining a Zacks Rank #3 or better and a positive Earnings ESP, stocks produced a positive surprise 70% of the time, while they also saw 28.3% annual returns on average, according to our 10 year backtest.
Natural Gas Services provides compression equipment supporting oil and gas production across U.S. basins. The Flatrock acquisition should deepen its Permian presence, establish scale in the Eagle Ford, broaden the customer base and accelerate electric-compression exposure. Shared equipment platforms may improve maintenance efficiency, while expanded large-horsepower capacity and credit availability could support organic growth, cash generation and shareholder returns.
Potential Risks
The acquisition raises leverage and integration demands, while customer concentration remains meaningful. Oilfield weakness, lower utilization, contract losses, inflation, fabrication constraints or financing pressure could undermine expected accretion.
Forecast
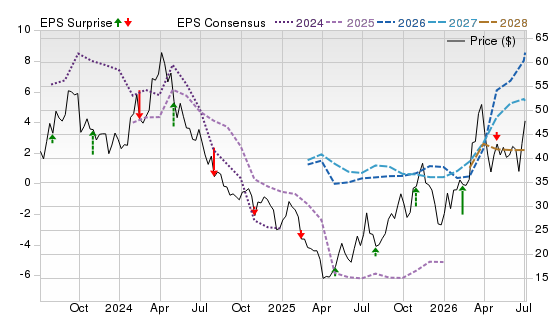
A Zacks Rank #1, combined with B scores for Value and Growth and an A for Momentum, indicates broad factor support. The chart shows a sustained price uptrend and stepwise increases in 2026 and 2027 consensus estimates. A 17.78% latest-quarter beat reinforces the positive surprise pattern and revision trend, although the shares could retreat if utilization or pricing softens.
This is our short term rating system that serves as a timeliness indicator for stocks over the next 1 to 3 months. How good is it? See rankings and related performance below.
The Zacks Industry Rank assigns a rating to each of the 265 X (Expanded) Industries based on their average Zacks Rank.
An industry with a larger percentage of Zacks Rank #1's and #2's will have a better average Zacks Rank than one with a larger percentage of Zacks Rank #4's and #5's.
The industry with the best average Zacks Rank would be considered the top industry (1 out of 265), which would place it in the top 1% of Zacks Ranked Industries. The industry with the worst average Zacks Rank (265 out of 265) would place in the bottom 1%.
The Zacks Sector Rank assigns a rating to each of the 16 Sectors based on their average Zacks Rank.
A sector with a larger percentage of Zacks Rank #1's and #2's will have a better average Zacks Rank than one with a larger percentage of Zacks Rank #4's and #5's.
The sector with the best average Zacks Rank would be considered the top sector (1 out of 16), which would place it in the top 1% of Zacks Ranked Sectors. The sector with the worst average Zacks Rank (16 out of 16) would place in the bottom 1%.
The Style Scores are a complementary set of indicators to use alongside the Zacks Rank. It allows the user to better focus on the stocks that are the best fit for his or her personal trading style.
The scores are based on the trading styles of Value, Growth, and Momentum. There's also a VGM Score ('V' for Value, 'G' for Growth and 'M' for Momentum), which combines the weighted average of the individual style scores into one score.
Value ScoreA
Growth ScoreA
Momentum ScoreA
VGM ScoreA
Within each Score, stocks are graded into five groups: A, B, C, D and F. As you might remember from your school days, an A, is better than a B; a B is better than a C; a C is better than a D; and a D is better than an F.
As an investor, you want to buy stocks with the highest probability of success. That means you want to buy stocks with a Zacks Rank #1 or #2, Strong Buy or Buy, which also has a Score of an A or a B in your personal trading style.
Zacks Earnings ESP (Expected Surprise Prediction) looks to find companies that have recently seen positive earnings estimate revision activity. The idea is that more recent information is, generally speaking, more accurate and can be a better predictor of the future, which can give investors an advantage in earnings season.
The technique has proven to be very useful for finding positive surprises. In fact, when combining a Zacks Rank #3 or better and a positive Earnings ESP, stocks produced a positive surprise 70% of the time, while they also saw 28.3% annual returns on average, according to our 10 year backtest.
Suncor is a Canadian integrated energy producer spanning oil sands, offshore assets, refining and fuel marketing. Its long-life reserves, connected infrastructure and feedstock flexibility should support reliable output and stronger margins. Management targets further breakeven reductions, upstream growth and higher free funds flow by 2028, which could meaningfully expand shareholder returns while preserving balance-sheet resilience and funding selective growth projects.
Potential Risks
Commodity-price swings, weaker refining margins and rising natural-gas costs could reduce cash flow, while planned maintenance, project execution, regulation and equipment reliability may disrupt growth targets.
Forecast
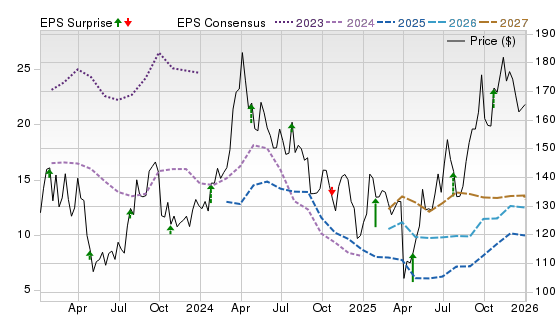
A Zacks Rank #1 points to favorable revisions, and the A Value score supports the valuation case. However, C Growth and F Momentum scores indicate uneven factor support. The chart shows a long advance followed by a sharp pullback, while 2026-2028 consensus estimates rebounded abruptly after deep cuts. The latest 2.76% miss suggests improving expectations are not yet translating into clean execution.
This is our short term rating system that serves as a timeliness indicator for stocks over the next 1 to 3 months. How good is it? See rankings and related performance below.
The Zacks Industry Rank assigns a rating to each of the 265 X (Expanded) Industries based on their average Zacks Rank.
An industry with a larger percentage of Zacks Rank #1's and #2's will have a better average Zacks Rank than one with a larger percentage of Zacks Rank #4's and #5's.
The industry with the best average Zacks Rank would be considered the top industry (1 out of 265), which would place it in the top 1% of Zacks Ranked Industries. The industry with the worst average Zacks Rank (265 out of 265) would place in the bottom 1%.
The Zacks Sector Rank assigns a rating to each of the 16 Sectors based on their average Zacks Rank.
A sector with a larger percentage of Zacks Rank #1's and #2's will have a better average Zacks Rank than one with a larger percentage of Zacks Rank #4's and #5's.
The sector with the best average Zacks Rank would be considered the top sector (1 out of 16), which would place it in the top 1% of Zacks Ranked Sectors. The sector with the worst average Zacks Rank (16 out of 16) would place in the bottom 1%.
The Style Scores are a complementary set of indicators to use alongside the Zacks Rank. It allows the user to better focus on the stocks that are the best fit for his or her personal trading style.
The scores are based on the trading styles of Value, Growth, and Momentum. There's also a VGM Score ('V' for Value, 'G' for Growth and 'M' for Momentum), which combines the weighted average of the individual style scores into one score.
Value ScoreA
Growth ScoreA
Momentum ScoreA
VGM ScoreA
Within each Score, stocks are graded into five groups: A, B, C, D and F. As you might remember from your school days, an A, is better than a B; a B is better than a C; a C is better than a D; and a D is better than an F.
As an investor, you want to buy stocks with the highest probability of success. That means you want to buy stocks with a Zacks Rank #1 or #2, Strong Buy or Buy, which also has a Score of an A or a B in your personal trading style.
Zacks Earnings ESP (Expected Surprise Prediction) looks to find companies that have recently seen positive earnings estimate revision activity. The idea is that more recent information is, generally speaking, more accurate and can be a better predictor of the future, which can give investors an advantage in earnings season.
The technique has proven to be very useful for finding positive surprises. In fact, when combining a Zacks Rank #3 or better and a positive Earnings ESP, stocks produced a positive surprise 70% of the time, while they also saw 28.3% annual returns on average, according to our 10 year backtest.
Imperial Oil is a leading integrated Canadian energy company with upstream production, refining, chemicals and fuel marketing operations. Its focus on maximizing the value of existing assets, advancing technology-led projects, expanding renewable diesel capacity and enhancing operational efficiency positions the company to generate sustainable cash flows and strengthen long-term shareholder returns while supporting future growth initiatives.
Potential Risks
Commodity-price swings, stricter environmental regulations, project delays, operational disruptions, technology execution challenges and dependence on supportive policies could affect profitability, cash generation and long-term growth prospects.
Forecast
A Zacks Rank #1 signals favorable estimate revisions, while B Value offers some valuation support. D Growth and F Momentum, however, warn that fundamentals and price action are less balanced. The chart shows a multiyear climb followed by a pullback, with 2026-2028 estimates snapping higher after reductions. Flat last-quarter EPS growth and a 15.57% miss make operational reliability especially important.
The Zacks Rank is a proprietary stock-rating model that uses trends in earnings estimate revisions and earnings-per-share (EPS) surprises to classify stocks into five groups: #1 (Strong Buy), #2 (Buy), #3 (Hold), #4 (Sell) and #5 (Strong Sell). The Zacks Rank is calculated through four primary factors related to earnings estimates: analysts' consensus on earnings estimate revisions, the magnitude of revision change, the upside potential and estimate surprise (or the degree in which earnings per share deviated from the previous quarter).
Zacks builds the data from 3,000 analysts at over 150 different brokerage firms. The average yearly gain for Zacks Rank #1 (Strong Buy) stocks is +23.94% per year from January, 1988, through June 1, 2026.
Selections for Best Oil Stocks are based on the current top ranking stocks out of 343 stocks based on Zacks Indicator Score, Style Scores and fundamentals. All stocks have a daily trading volume of at least 100,000 shares and has a stock price of at least $5. All information is current as of market open, July 14, 2026.
Understanding Oil Stocks
Oil stocks represent companies involved in discovering, producing, transporting, refining, or selling petroleum products. Each segment reacts differently to oil price changes and economic cycles.
Types of oil stocks
Upstream oil stocks
Upstream companies focus on exploration and production (E&P). Their earnings are most sensitive to crude oil prices.
Oil prices directly influence upstream profits, indirectly affect refiners through input costs, and have limited impact on midstream cash flows. Stock performance depends not just on oil prices but also on hedging, cost structure, and capital allocation.
Are oil stocks good long-term investments?
Oil stocks can be long-term holdings when purchased at reasonable valuations and paired with dividend reinvestment. However, long-term returns tend to trail high-growth sectors unless investors emphasize income and valuation discipline.
Are oil stocks good during inflation or recessions?
Oil stocks often perform well during inflationary periods because energy prices rise alongside costs. During recessions, demand declines can pressure oil prices, making defensive, dividend-paying companies more attractive than cyclical producers.
How volatile are oil stocks compared to other energy stocks?
Oil producers are generally more volatile than utilities or renewable energy stocks but less volatile than early-stage clean-energy firms. Integrated majors tend to be the least volatile within the oil sector. (See our picks for Best Energy Stocks to buy now.)
How will renewable energy trends affect oil stocks?
Renewables are a long-term competitive force, but oil demand remains supported by transportation, petrochemicals, and emerging markets. Many oil majors are investing selectively in low-carbon technologies to diversify future revenue streams.
How to Evaluate Oil Stocks
What metrics should I look at when evaluating oil stocks?
Key metrics include:
Free cash flow yield.
Break-even oil price.
Debt-to-equity ratio.
Reserve life index.
Dividend payout sustainability.
Capital return policies (dividends and buybacks).
How to analyze an oil company’s reserves and production growth?
Investors should examine proven reserves, reserve replacement ratios, and production growth guidance. Companies that replace reserves without excessive spending are generally higher quality.
How to Compare Oil Stocks
Oil stocks vs. natural gas stocks: What’s better?
Oil stocks offer broader global demand exposure, while natural gas stocks are often tied to regional pricing and LNG exports. Oil tends to be more geopolitically sensitive, while gas is more infrastructure-driven.
Oil stocks vs. energy ETFs: What’s better?
Individual oil stocks allow targeted exposure and income strategies, while energy ETFs provide diversification and lower company-specific risk.
Are oil ETFs better than buying individual oil stocks?
ETFs such as broad energy or oil-focused funds can reduce volatility, but they dilute high performers. Stock pickers may prefer individual companies with superior capital discipline.
How to Buy Oil Stocks
How do I invest in oil stocks?
Oil stocks can be purchased through standard brokerage accounts, retirement accounts, or dividend-focused portfolios. Investors should consider position sizing due to sector volatility.
What is the easiest way to get exposure to oil?
Energy ETFs or integrated oil majors offer simple exposure without the complexity of futures or leveraged products.
Should I buy oil stocks or trade crude oil futures?
Oil stocks are better suited for long-term investors, while crude futures are primarily for short-term traders and hedgers due to leverage and roll costs.
Oil Stocks Investment Strategy
How often should I rebalance an oil-focused portfolio?
Annual or semiannual rebalancing is typically sufficient unless oil prices experience extreme volatility.
When should I sell oil stocks?
Common sell signals include deteriorating balance sheets, dividend cuts, excessive capital spending, or valuations that exceed historical norms.
What are the tax implications of holding or selling oil stocks?
Dividends are generally taxable, while capital gains depend on holding period. Master limited partnerships (MLPs) may involve more complex tax reporting.
Alternatives to Oil Stocks
Should I invest in renewable energy stocks instead?
Renewable energy stocks offer growth potential but often lack the cash flow stability of oil majors. A blended energy portfolio can balance income and growth.
What are the safest alternatives to oil stocks?
Energy infrastructure companies, utilities, and diversified energy ETFs are typically less volatile alternatives for conservative investors.
Bottom Line
The best oil stocks in 2026 are not defined by aggressive production growth but by capital discipline, resilient cash flow, and shareholder returns. Investors who understand the cyclical nature of oil and focus on quality businesses can still find oil stocks to be a valuable part of a diversified portfolio.