We use cookies to understand how you use our site and to improve your experience.
This includes personalizing content and advertising.
By pressing "Accept All" or closing out of this banner, you consent to the use of all cookies and similar technologies and the sharing of information they collect with third parties.
You can reject marketing cookies by pressing "Deny Optional," but we still use essential, performance, and functional cookies.
In addition, whether you "Accept All," Deny Optional," click the X or otherwise continue to use the site, you accept our Privacy Policy and Terms of Service, revised from time to time.
You are being directed to ZacksTrade, a division of LBMZ Securities and licensed broker-dealer. ZacksTrade and Zacks.com are separate companies. The web link between the two companies is not a solicitation or offer to invest in a particular security or type of security. ZacksTrade does not endorse or adopt any particular investment strategy, any analyst opinion/rating/report or any approach to evaluating individual securities.
If you wish to go to ZacksTrade, click OK. If you do not, click Cancel.
The utilities sector includes electric, gas, and water providers that operate in regulated markets.
As utility stocks offer predictable revenue, they are seen as defensive holdings in a diversified portfolio.
Top utility stocks to buy now include Sabesp, NextEra Energy and MGE Energy.
Utility stocks have long served as a cornerstone for conservative investors seeking income, relative stability, and downside protection. In periods of economic uncertainty, their regulated business models and consistent cash flows tend to stand out. Now, as interest rate expectations evolve and electricity demand accelerates from AI data centers, broader electrification, and renewable energy expansion, the sector is drawing renewed attention in 2026.
Below is a comprehensive guide to the best utility stocks, highlighting high performers, leading dividend payers, potentially undervalued opportunities, and companies with durable long term compounding potential.
Utility Stock Market Overview and Forecast
The utilities sector includes electric, gas, and water providers that operate in regulated markets. Because these companies generate predictable revenue streams, they are often seen as defensive holdings within a diversified portfolio.
In 2026, several forces are shaping the sector:
Rising electricity demand from data centers and AI infrastructure.
Grid modernization and renewable energy investments.
Interest-rate stabilization after prior tightening cycles.
Increased focus on ESG and decarbonization initiatives.
Utilities have historically outperformed during volatile or slowing markets, though they can lag in strong bull runs when investors favor higher growth sectors. Even so, improving earnings outlooks and capital investment plans are helping narrow that performance gap.
Is Now a Good Time to Invest in Utility Stocks?
Many analysts suggest utilities may benefit if interest rates stabilize or decline. Lower borrowing costs can improve margins because utilities rely heavily on debt financing for infrastructure projects. Meanwhile, steady dividend yields — often ranging between 3% and 6% — remain attractive compared to broader market averages.
Below, we examine and rank leading utility stocks using a blend of Zacks Rank signals, Style Scores, and core fundamental metrics to identify companies that may offer compelling long term opportunities for patient investors.
Company (Ticker)
12 Week Price Change
Forward PE
Price
Proj EPS Growth (1 Year)
Projected Sales Growth (1Y)
Research
Companhia de saneamento Basico Do Estado De Sao Paulo Sabesp (SBS)
This is our short term rating system that serves as a timeliness indicator for stocks over the next 1 to 3 months. How good is it? See rankings and related performance below.
The Zacks Industry Rank assigns a rating to each of the 265 X (Expanded) Industries based on their average Zacks Rank.
An industry with a larger percentage of Zacks Rank #1's and #2's will have a better average Zacks Rank than one with a larger percentage of Zacks Rank #4's and #5's.
The industry with the best average Zacks Rank would be considered the top industry (1 out of 265), which would place it in the top 1% of Zacks Ranked Industries. The industry with the worst average Zacks Rank (265 out of 265) would place in the bottom 1%.
The Zacks Sector Rank assigns a rating to each of the 16 Sectors based on their average Zacks Rank.
A sector with a larger percentage of Zacks Rank #1's and #2's will have a better average Zacks Rank than one with a larger percentage of Zacks Rank #4's and #5's.
The sector with the best average Zacks Rank would be considered the top sector (1 out of 16), which would place it in the top 1% of Zacks Ranked Sectors. The sector with the worst average Zacks Rank (16 out of 16) would place in the bottom 1%.
The Style Scores are a complementary set of indicators to use alongside the Zacks Rank. It allows the user to better focus on the stocks that are the best fit for his or her personal trading style.
The scores are based on the trading styles of Value, Growth, and Momentum. There's also a VGM Score ('V' for Value, 'G' for Growth and 'M' for Momentum), which combines the weighted average of the individual style scores into one score.
Value ScoreA
Growth ScoreA
Momentum ScoreA
VGM ScoreA
Within each Score, stocks are graded into five groups: A, B, C, D and F. As you might remember from your school days, an A, is better than a B; a B is better than a C; a C is better than a D; and a D is better than an F.
As an investor, you want to buy stocks with the highest probability of success. That means you want to buy stocks with a Zacks Rank #1 or #2, Strong Buy or Buy, which also has a Score of an A or a B in your personal trading style.
Zacks Earnings ESP (Expected Surprise Prediction) looks to find companies that have recently seen positive earnings estimate revision activity. The idea is that more recent information is, generally speaking, more accurate and can be a better predictor of the future, which can give investors an advantage in earnings season.
The technique has proven to be very useful for finding positive surprises. In fact, when combining a Zacks Rank #3 or better and a positive Earnings ESP, stocks produced a positive surprise 70% of the time, while they also saw 28.3% annual returns on average, according to our 10 year backtest.
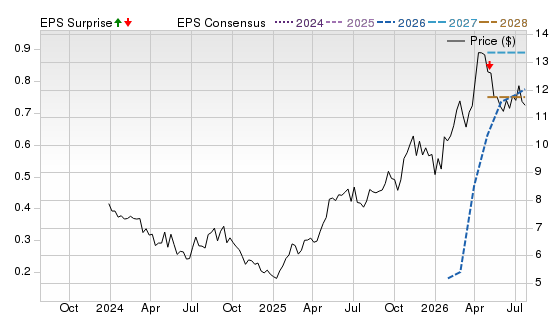
Sabesp provides water and sewage services across São Paulo, positioning it to benefit from Brazil’s sanitation buildout. Privatization creates room for cost discipline, lower water losses and faster execution, while mandated universalization targets support a long investment runway. Scale, essential demand and tariff mechanisms should help convert network expansion into durable cash generation.
Potential Risks
The opportunity requires heavy capital spending and exposes returns to regulatory decisions, construction inflation and execution slippage. Political resistance to private control, affordability concerns, drought conditions, Brazilian interest rates and currency volatility could pressure the ADR.
Forecast
A Zacks Rank #1 (Strong Buy) signals strong estimate revision momentum. The Value Score of B and Momentum Score of B are supportive, but the Growth Score of F tempers the outlook. The Price, Consensus and EPS Surprise chart shows a powerful price advance and a sharp upward reset in the 2026 consensus, followed by higher 2027 expectations.
This is our short term rating system that serves as a timeliness indicator for stocks over the next 1 to 3 months. How good is it? See rankings and related performance below.
The Zacks Industry Rank assigns a rating to each of the 265 X (Expanded) Industries based on their average Zacks Rank.
An industry with a larger percentage of Zacks Rank #1's and #2's will have a better average Zacks Rank than one with a larger percentage of Zacks Rank #4's and #5's.
The industry with the best average Zacks Rank would be considered the top industry (1 out of 265), which would place it in the top 1% of Zacks Ranked Industries. The industry with the worst average Zacks Rank (265 out of 265) would place in the bottom 1%.
The Zacks Sector Rank assigns a rating to each of the 16 Sectors based on their average Zacks Rank.
A sector with a larger percentage of Zacks Rank #1's and #2's will have a better average Zacks Rank than one with a larger percentage of Zacks Rank #4's and #5's.
The sector with the best average Zacks Rank would be considered the top sector (1 out of 16), which would place it in the top 1% of Zacks Ranked Sectors. The sector with the worst average Zacks Rank (16 out of 16) would place in the bottom 1%.
The Style Scores are a complementary set of indicators to use alongside the Zacks Rank. It allows the user to better focus on the stocks that are the best fit for his or her personal trading style.
The scores are based on the trading styles of Value, Growth, and Momentum. There's also a VGM Score ('V' for Value, 'G' for Growth and 'M' for Momentum), which combines the weighted average of the individual style scores into one score.
Value ScoreA
Growth ScoreA
Momentum ScoreA
VGM ScoreA
Within each Score, stocks are graded into five groups: A, B, C, D and F. As you might remember from your school days, an A, is better than a B; a B is better than a C; a C is better than a D; and a D is better than an F.
As an investor, you want to buy stocks with the highest probability of success. That means you want to buy stocks with a Zacks Rank #1 or #2, Strong Buy or Buy, which also has a Score of an A or a B in your personal trading style.
Zacks Earnings ESP (Expected Surprise Prediction) looks to find companies that have recently seen positive earnings estimate revision activity. The idea is that more recent information is, generally speaking, more accurate and can be a better predictor of the future, which can give investors an advantage in earnings season.
The technique has proven to be very useful for finding positive surprises. In fact, when combining a Zacks Rank #3 or better and a positive Earnings ESP, stocks produced a positive surprise 70% of the time, while they also saw 28.3% annual returns on average, according to our 10 year backtest.
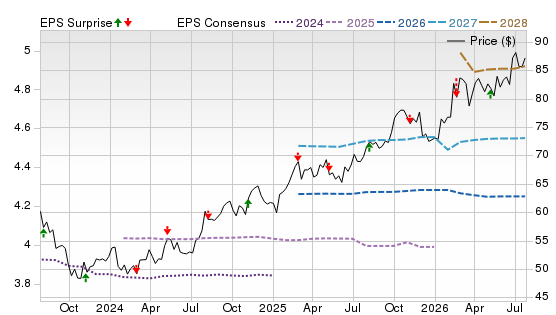
NextEra Energy combines Florida Power and Light with a renewable generation platform. Florida population growth, grid modernization and data center demand can expand the regulated rate base, while Energy Resources has a pipeline in wind, solar and storage. Its development scale, access to capital and dividend growth record provide several paths to earnings growth.
Potential Risks
Construction commitments make NextEra sensitive to interest rates, financing conditions and equipment bottlenecks. Tax policy changes, permitting delays, hurricane costs and regulatory rulings could weaken project economics. The shares also command a quality premium, increasing sensitivity to slower growth.
Forecast
A Zacks Rank #2 (Buy) points to favorable near-term estimate revisions. The Value Score of D and Growth Score of F are weak, while the Momentum Score of C is neutral. The chart shows a strong share price recovery, but 2026 and 2027 consensus lines flatten after earlier increases. Mixed earnings surprises suggest dependable visibility rather than a consistent beat-and-raise cycle.
This is our short term rating system that serves as a timeliness indicator for stocks over the next 1 to 3 months. How good is it? See rankings and related performance below.
The Zacks Industry Rank assigns a rating to each of the 265 X (Expanded) Industries based on their average Zacks Rank.
An industry with a larger percentage of Zacks Rank #1's and #2's will have a better average Zacks Rank than one with a larger percentage of Zacks Rank #4's and #5's.
The industry with the best average Zacks Rank would be considered the top industry (1 out of 265), which would place it in the top 1% of Zacks Ranked Industries. The industry with the worst average Zacks Rank (265 out of 265) would place in the bottom 1%.
The Zacks Sector Rank assigns a rating to each of the 16 Sectors based on their average Zacks Rank.
A sector with a larger percentage of Zacks Rank #1's and #2's will have a better average Zacks Rank than one with a larger percentage of Zacks Rank #4's and #5's.
The sector with the best average Zacks Rank would be considered the top sector (1 out of 16), which would place it in the top 1% of Zacks Ranked Sectors. The sector with the worst average Zacks Rank (16 out of 16) would place in the bottom 1%.
The Style Scores are a complementary set of indicators to use alongside the Zacks Rank. It allows the user to better focus on the stocks that are the best fit for his or her personal trading style.
The scores are based on the trading styles of Value, Growth, and Momentum. There's also a VGM Score ('V' for Value, 'G' for Growth and 'M' for Momentum), which combines the weighted average of the individual style scores into one score.
Value ScoreA
Growth ScoreA
Momentum ScoreA
VGM ScoreA
Within each Score, stocks are graded into five groups: A, B, C, D and F. As you might remember from your school days, an A, is better than a B; a B is better than a C; a C is better than a D; and a D is better than an F.
As an investor, you want to buy stocks with the highest probability of success. That means you want to buy stocks with a Zacks Rank #1 or #2, Strong Buy or Buy, which also has a Score of an A or a B in your personal trading style.
Zacks Earnings ESP (Expected Surprise Prediction) looks to find companies that have recently seen positive earnings estimate revision activity. The idea is that more recent information is, generally speaking, more accurate and can be a better predictor of the future, which can give investors an advantage in earnings season.
The technique has proven to be very useful for finding positive surprises. In fact, when combining a Zacks Rank #3 or better and a positive Earnings ESP, stocks produced a positive surprise 70% of the time, while they also saw 28.3% annual returns on average, according to our 10 year backtest.
MGE Energy owns Madison Gas and Electric, a regulated utility serving Wisconsin. Utility network investment can expand the rate base, while solar, transmission ownership and coal retirement should modernize the portfolio. Its compact service territory, constructive regulation and a long dividend growth record reinforce its defensive appeal.
Potential Risks
MGE’s small scale and geographic concentration limit diversification. Weather swings, regulatory lag, higher borrowing costs and inflation can pressure returns, while the transition away from coal may require more spending. A premium valuation could cap upside if growth stays modest.
Forecast
A Zacks Rank #2 indicates improving estimate direction. However, the Value Score of D and Growth Score of D remain soft, and the Momentum Score of C offers limited support. The chart shows volatile shares and a downward reset in 2026 consensus before stabilization, with 2027 estimates recovering. Alternating beats and misses argue for cautious optimism rather than confidence in repeated upside surprises.
This is our short term rating system that serves as a timeliness indicator for stocks over the next 1 to 3 months. How good is it? See rankings and related performance below.
The Zacks Industry Rank assigns a rating to each of the 265 X (Expanded) Industries based on their average Zacks Rank.
An industry with a larger percentage of Zacks Rank #1's and #2's will have a better average Zacks Rank than one with a larger percentage of Zacks Rank #4's and #5's.
The industry with the best average Zacks Rank would be considered the top industry (1 out of 265), which would place it in the top 1% of Zacks Ranked Industries. The industry with the worst average Zacks Rank (265 out of 265) would place in the bottom 1%.
The Zacks Sector Rank assigns a rating to each of the 16 Sectors based on their average Zacks Rank.
A sector with a larger percentage of Zacks Rank #1's and #2's will have a better average Zacks Rank than one with a larger percentage of Zacks Rank #4's and #5's.
The sector with the best average Zacks Rank would be considered the top sector (1 out of 16), which would place it in the top 1% of Zacks Ranked Sectors. The sector with the worst average Zacks Rank (16 out of 16) would place in the bottom 1%.
The Style Scores are a complementary set of indicators to use alongside the Zacks Rank. It allows the user to better focus on the stocks that are the best fit for his or her personal trading style.
The scores are based on the trading styles of Value, Growth, and Momentum. There's also a VGM Score ('V' for Value, 'G' for Growth and 'M' for Momentum), which combines the weighted average of the individual style scores into one score.
Value ScoreA
Growth ScoreA
Momentum ScoreA
VGM ScoreA
Within each Score, stocks are graded into five groups: A, B, C, D and F. As you might remember from your school days, an A, is better than a B; a B is better than a C; a C is better than a D; and a D is better than an F.
As an investor, you want to buy stocks with the highest probability of success. That means you want to buy stocks with a Zacks Rank #1 or #2, Strong Buy or Buy, which also has a Score of an A or a B in your personal trading style.
Zacks Earnings ESP (Expected Surprise Prediction) looks to find companies that have recently seen positive earnings estimate revision activity. The idea is that more recent information is, generally speaking, more accurate and can be a better predictor of the future, which can give investors an advantage in earnings season.
The technique has proven to be very useful for finding positive surprises. In fact, when combining a Zacks Rank #3 or better and a positive Earnings ESP, stocks produced a positive surprise 70% of the time, while they also saw 28.3% annual returns on average, according to our 10 year backtest.
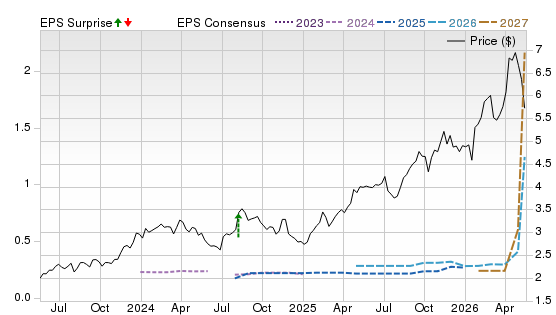
Copel operates generation, transmission and distribution assets across Brazil, with hydroelectric exposure. Its transition to dispersed ownership can encourage tighter costs, disciplined capital allocation and higher asset productivity. Regulated network investment supplies earnings visibility, while renewable generation, transmission expansion and asset recycling support stronger cash flow and dividends.
Potential Risks
Hydrology is central because weak rainfall can reduce output and raise power costs. Currency swings, Brazilian interest rates, political intervention and shifting regulation can affect the ADR. Restructuring benefits could arrive slowly, and a high payout can become less secure if capital needs rise.
Forecast
A Zacks Rank #2 suggests constructive estimate revisions. The Value Score of B and Momentum Score of A strengthen the case, although the Growth Score of D limits enthusiasm. The chart places the shares near recent highs, while 2026 and 2027 consensus estimates trend upward and 2028 remains elevated. Mostly positive surprise markers support momentum, though execution must validate that rerating.
This is our short term rating system that serves as a timeliness indicator for stocks over the next 1 to 3 months. How good is it? See rankings and related performance below.
The Zacks Industry Rank assigns a rating to each of the 265 X (Expanded) Industries based on their average Zacks Rank.
An industry with a larger percentage of Zacks Rank #1's and #2's will have a better average Zacks Rank than one with a larger percentage of Zacks Rank #4's and #5's.
The industry with the best average Zacks Rank would be considered the top industry (1 out of 265), which would place it in the top 1% of Zacks Ranked Industries. The industry with the worst average Zacks Rank (265 out of 265) would place in the bottom 1%.
The Zacks Sector Rank assigns a rating to each of the 16 Sectors based on their average Zacks Rank.
A sector with a larger percentage of Zacks Rank #1's and #2's will have a better average Zacks Rank than one with a larger percentage of Zacks Rank #4's and #5's.
The sector with the best average Zacks Rank would be considered the top sector (1 out of 16), which would place it in the top 1% of Zacks Ranked Sectors. The sector with the worst average Zacks Rank (16 out of 16) would place in the bottom 1%.
The Style Scores are a complementary set of indicators to use alongside the Zacks Rank. It allows the user to better focus on the stocks that are the best fit for his or her personal trading style.
The scores are based on the trading styles of Value, Growth, and Momentum. There's also a VGM Score ('V' for Value, 'G' for Growth and 'M' for Momentum), which combines the weighted average of the individual style scores into one score.
Value ScoreA
Growth ScoreA
Momentum ScoreA
VGM ScoreA
Within each Score, stocks are graded into five groups: A, B, C, D and F. As you might remember from your school days, an A, is better than a B; a B is better than a C; a C is better than a D; and a D is better than an F.
As an investor, you want to buy stocks with the highest probability of success. That means you want to buy stocks with a Zacks Rank #1 or #2, Strong Buy or Buy, which also has a Score of an A or a B in your personal trading style.
Zacks Earnings ESP (Expected Surprise Prediction) looks to find companies that have recently seen positive earnings estimate revision activity. The idea is that more recent information is, generally speaking, more accurate and can be a better predictor of the future, which can give investors an advantage in earnings season.
The technique has proven to be very useful for finding positive surprises. In fact, when combining a Zacks Rank #3 or better and a positive Earnings ESP, stocks produced a positive surprise 70% of the time, while they also saw 28.3% annual returns on average, according to our 10 year backtest.
Evergy is a regulated electric utility serving Kansas and Missouri, with exposure to industrial and data center growth. Large load additions could accelerate electricity sales and broaden the rate base. Planned generation, transmission and distribution investment offers an earnings runway, while an established dividend adds income support.
Potential Risks
The capital program raises dependence on timely regulatory recovery and affordable financing. Data center projects may be delayed or downsized, leaving infrastructure underused. Construction inflation, severe weather, cost overruns and political concern over customer bills could pressure returns. A strong rally leaves less room for disappointment.
Forecast
A Zacks Rank #2 signals favorable estimate revisions. The Value Score of C is acceptable, but the Growth Score of D and Momentum Score of D weaken the setup. The chart shows a sustained price uptrend and sharp upward steps in the 2026 and 2027 consensus, with 2028 also elevated. Limited surprise history means the estimate reset still needs confirmation through execution.
The Zacks Rank is a proprietary stock-rating model that uses trends in earnings estimate revisions and earnings-per-share (EPS) surprises to classify stocks into five groups: #1 (Strong Buy), #2 (Buy), #3 (Hold), #4 (Sell) and #5 (Strong Sell). The Zacks Rank is calculated through four primary factors related to earnings estimates: analysts' consensus on earnings estimate revisions, the magnitude of revision change, the upside potential and estimate surprise (or the degree in which earnings per share deviated from the previous quarter).
Zacks builds the data from 3,000 analysts at over 150 different brokerage firms. The average yearly gain for Zacks Rank #1 (Strong Buy) stocks is +23.94% per year from January 1, 1988, through July 6, 2026.
Selections for Best Utility Stocks are based on the current top ranking stocks based on Zacks Indicator Score, Style Scores and fundamentals. All stocks have a daily trading volume of at least 100,000 shares and have a stock price of at least $5. All information is current as of market open, July 20, 2026.
Guide to Best Utility Stocks: What Are Utility Stocks?
Utility stocks represent companies that provide essential services like electricity, natural gas, and water to residential and commercial customers.
How Do Utility Stocks Work?
Most utilities operate as regulated monopolies within defined geographic areas. State regulators set allowable rates of return, creating predictable revenue streams in exchange for infrastructure investment.
Why Do People Invest in Utility Stocks?
Reliable dividend income.
Lower volatility relative to growth stocks.
Defensive performance during economic slowdowns.
How Often Do Utility Stocks Pay Dividends in a Year?
Most U.S. utility companies pay dividends quarterly (four times per year).
Pros of Utility Stocks
Stable cash flow.
Recession resilience.
Attractive dividend yields.
Essential-service demand.
Cons of Utility Stocks
Interest-rate sensitivity.
Heavy capital expenditure needs.
Regulatory risk.
Slower growth compared to tech sectors.
Utility ETFs vs Utility Stocks
Investors can choose individual stocks or diversified ETFs.
Best Utility ETFs
Utilities Select Sector SPDR Fund (XLU)
Vanguard Utilities ETF (VPU)
iShares U.S. Utilities ETF (IDU)
ETFs offer instant diversification, while individual stocks may provide higher upside potential.
How to Choose the Best Utility Stocks
Consider:
Dividend yield and payout ratio.
Earnings and revenue consistency.
Regulatory environment strength.
Debt levels and credit ratings.
Renewable transition strategy.
Long-term infrastructure growth plans.
What Are the Utility Stocks That Are Good Investments?
Electric: Duke Energy (DUK), NextEra Energy (NEE). Water: American Water Works (AWK). Gas: Atmos Energy (ATO). ESG-friendly: Xcel Energy (XEL), NextEra Energy (NEE).
How to Buy Utility Stocks
Open a brokerage account.
Research financials and dividend history.
Decide between individual stocks or ETFs.
Monitor regulatory developments and earnings reports.
Tips for Building a Utility Portfolio
Blend high-yield and growth utilities.
Diversify across electric, gas, and water.
Include at least one ETF for balance.
Reinvest dividends for compounding.
Frequently Asked Questions About Utility Stocks
How Are Utility Dividends Taxed?
Most are qualified dividends taxed at long-term capital gains rates, though investors should verify individual tax situations.
Are Utility Stocks Safe During Recessions?
Historically, utilities have outperformed the broader market during downturns because demand for electricity and water remains steady.
What’s a Good Dividend Yield for Utility Stocks?
According to industry rankings from research firms like Zacks, many electric utilities historically yield between 3% and 5%, higher than the broader S&P 500 average.
Are Utility Stocks Safe for Beginners?
Yes, they are often considered beginner-friendly due to predictable earnings and dividends.
Are Utility Stocks Good for Passive Income?
They are widely used in income-focused portfolios because of consistent quarterly payouts.
How Do Utility Stocks Perform During Market Downturns?
They typically decline less than high-growth sectors but may still experience volatility during severe selloffs.
Is Now a Good Time to Invest in Utility Stocks?
With rising electricity demand and potential interest-rate stabilization, 2025 presents favorable conditions for selective utility investments.
How Do Rising Interest Rates Affect Utility Stocks?
Higher rates can pressure valuations because utilities rely heavily on debt and compete with bond yields for income-focused investors.
Bottom Line
The best utility stocks in March 2025 combine reliable dividends, manageable debt, constructive regulatory environments, and exposure to long-term electrification trends. Whether you prioritize income, growth, or retirement stability, utilities remain a foundational sector for diversified portfolios.


 Hold
Hold 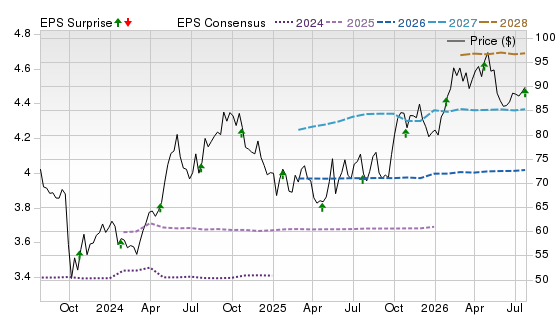

 Buy
Buy