We use cookies to understand how you use our site and to improve your experience.
This includes personalizing content and advertising.
By pressing "Accept All" or closing out of this banner, you consent to the use of all cookies and similar technologies and the sharing of information they collect with third parties.
You can reject marketing cookies by pressing "Deny Optional," but we still use essential, performance, and functional cookies.
In addition, whether you "Accept All," Deny Optional," click the X or otherwise continue to use the site, you accept our Privacy Policy and Terms of Service, revised from time to time.
You are being directed to ZacksTrade, a division of LBMZ Securities and licensed broker-dealer. ZacksTrade and Zacks.com are separate companies. The web link between the two companies is not a solicitation or offer to invest in a particular security or type of security. ZacksTrade does not endorse or adopt any particular investment strategy, any analyst opinion/rating/report or any approach to evaluating individual securities.
If you wish to go to ZacksTrade, click OK. If you do not, click Cancel.
Bank stocks can be attractive investments for income and value-oriented investors.
Bank stocks fall into four major categories: National, regional, investment and community banks.
The best bank stocks to buy now include BankUnited, Amerant Bancorp and California BanCorp.
Bank stocks remain one of the most closely watched corners of the financial sector in 2026. Investors are weighing a mix of lower interest rates, loan growth trends, commercial real estate concerns, and recession risks when deciding whether to add bank stocks to their portfolios.
The banking sector offers investors exposure to dividend income, economic growth, and financial stability. Large money-center banks such as JPMorgan Chase and Bank of America continue to dominate, while regional banks may offer more upside for investors willing to accept higher risk.
Here’s what investors should know before buying bank stocks in 2026.
Bank Stock Market Trend in 2026
Bank stocks entered 2026 in recovery mode after a volatile few years marked by aggressive Federal Reserve rate hikes, deposit competition, and regional bank stress.
Several themes are driving bank stock performance this year:
Falling interest rates are reducing funding pressure on banks.
Loan demand is gradually improving.
Credit quality remains stable but is closely monitored.
Commercial real estate exposure remains a major risk for some regional banks.
Large banks have generally outperformed regional banks due to stronger balance sheets, diversified revenue, and lower funding risk.
Investment analysts note that valuations remain attractive in many bank stocks compared with broader market sectors, especially after recent underperformance.
Are bank stocks a good investment?
Bank stocks can be attractive investments for income and value-oriented investors.
Banks generate revenue primarily from:
Lending money.
Collecting interest.
Charging fees.
Wealth management and investment banking.
Bank stocks often appeal to investors because they can provide:
Dividend income.
Long-term capital appreciation.
Economic cycle exposure.
Lower valuations versus tech stocks.
However, banks are highly sensitive to economic conditions, credit losses, and interest rate changes.
When the economy expands, bank stocks often perform well because lending activity rises and defaults remain low. During recessions, bank profits can decline quickly.
Below, we examine and rank leading bank stocks using a blend of Zacks Rank signals, Style Scores, and key fundamental metrics to help identify companies that may offer attractive long-term potential.
This is our short term rating system that serves as a timeliness indicator for stocks over the next 1 to 3 months. How good is it? See rankings and related performance below.
The Zacks Industry Rank assigns a rating to each of the 265 X (Expanded) Industries based on their average Zacks Rank.
An industry with a larger percentage of Zacks Rank #1's and #2's will have a better average Zacks Rank than one with a larger percentage of Zacks Rank #4's and #5's.
The industry with the best average Zacks Rank would be considered the top industry (1 out of 265), which would place it in the top 1% of Zacks Ranked Industries. The industry with the worst average Zacks Rank (265 out of 265) would place in the bottom 1%.
The Zacks Sector Rank assigns a rating to each of the 16 Sectors based on their average Zacks Rank.
A sector with a larger percentage of Zacks Rank #1's and #2's will have a better average Zacks Rank than one with a larger percentage of Zacks Rank #4's and #5's.
The sector with the best average Zacks Rank would be considered the top sector (1 out of 16), which would place it in the top 1% of Zacks Ranked Sectors. The sector with the worst average Zacks Rank (16 out of 16) would place in the bottom 1%.
The Style Scores are a complementary set of indicators to use alongside the Zacks Rank. It allows the user to better focus on the stocks that are the best fit for his or her personal trading style.
The scores are based on the trading styles of Value, Growth, and Momentum. There's also a VGM Score ('V' for Value, 'G' for Growth and 'M' for Momentum), which combines the weighted average of the individual style scores into one score.
Value ScoreA
Growth ScoreA
Momentum ScoreA
VGM ScoreA
Within each Score, stocks are graded into five groups: A, B, C, D and F. As you might remember from your school days, an A, is better than a B; a B is better than a C; a C is better than a D; and a D is better than an F.
As an investor, you want to buy stocks with the highest probability of success. That means you want to buy stocks with a Zacks Rank #1 or #2, Strong Buy or Buy, which also has a Score of an A or a B in your personal trading style.
Zacks Earnings ESP (Expected Surprise Prediction) looks to find companies that have recently seen positive earnings estimate revision activity. The idea is that more recent information is, generally speaking, more accurate and can be a better predictor of the future, which can give investors an advantage in earnings season.
The technique has proven to be very useful for finding positive surprises. In fact, when combining a Zacks Rank #3 or better and a positive Earnings ESP, stocks produced a positive surprise 70% of the time, while they also saw 28.3% annual returns on average, according to our 10 year backtest.
BankUnited is a Florida-based regional bank serving commercial, small-business, and consumer clients through loans, deposits, and treasury services. Its appeal is a balance-sheet recovery story. Recent results, dividend action and management updates point to better net interest income, firmer margin trends and improving deposit mix versus last year, giving investors a clearer path to higher profitability if credit stays manageable.
Potential Risks
CRE and office exposure remain risks, while weak loan demand may cap revenue growth. Sticky funding costs, yield repricing, reserves, regulation, and macro pressure could offset margin gains.
Forecast
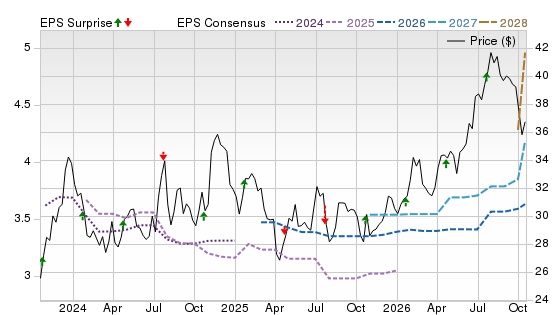
A Zacks Rank #1 (Buy) is constructive, while the Value Score of C, Growth F, and Momentum B imply a selective recovery call. The Price, Consensus & EPS Surprise chart shows price rebounding from 2024-2025 weakness, rising 2027-2028 EPS estimates, and mixed recent surprises, implying that the upside is tied to continued NIM progress and cleaner credit.
This is our short term rating system that serves as a timeliness indicator for stocks over the next 1 to 3 months. How good is it? See rankings and related performance below.
The Zacks Industry Rank assigns a rating to each of the 265 X (Expanded) Industries based on their average Zacks Rank.
An industry with a larger percentage of Zacks Rank #1's and #2's will have a better average Zacks Rank than one with a larger percentage of Zacks Rank #4's and #5's.
The industry with the best average Zacks Rank would be considered the top industry (1 out of 265), which would place it in the top 1% of Zacks Ranked Industries. The industry with the worst average Zacks Rank (265 out of 265) would place in the bottom 1%.
The Zacks Sector Rank assigns a rating to each of the 16 Sectors based on their average Zacks Rank.
A sector with a larger percentage of Zacks Rank #1's and #2's will have a better average Zacks Rank than one with a larger percentage of Zacks Rank #4's and #5's.
The sector with the best average Zacks Rank would be considered the top sector (1 out of 16), which would place it in the top 1% of Zacks Ranked Sectors. The sector with the worst average Zacks Rank (16 out of 16) would place in the bottom 1%.
The Style Scores are a complementary set of indicators to use alongside the Zacks Rank. It allows the user to better focus on the stocks that are the best fit for his or her personal trading style.
The scores are based on the trading styles of Value, Growth, and Momentum. There's also a VGM Score ('V' for Value, 'G' for Growth and 'M' for Momentum), which combines the weighted average of the individual style scores into one score.
Value ScoreA
Growth ScoreA
Momentum ScoreA
VGM ScoreA
Within each Score, stocks are graded into five groups: A, B, C, D and F. As you might remember from your school days, an A, is better than a B; a B is better than a C; a C is better than a D; and a D is better than an F.
As an investor, you want to buy stocks with the highest probability of success. That means you want to buy stocks with a Zacks Rank #1 or #2, Strong Buy or Buy, which also has a Score of an A or a B in your personal trading style.
Zacks Earnings ESP (Expected Surprise Prediction) looks to find companies that have recently seen positive earnings estimate revision activity. The idea is that more recent information is, generally speaking, more accurate and can be a better predictor of the future, which can give investors an advantage in earnings season.
The technique has proven to be very useful for finding positive surprises. In fact, when combining a Zacks Rank #3 or better and a positive Earnings ESP, stocks produced a positive surprise 70% of the time, while they also saw 28.3% annual returns on average, according to our 10 year backtest.
Amerant Bancorp is a Florida-based bank offering commercial, consumer, wealth, mortgage, and treasury-management services. The attraction is a turnaround with new leadership. Recent quarter results showed net income rebounding sharply from the prior quarter, signaling improved operating leverage after a tough 2025. Credit cleanup and loan-portfolio optimization support confidence that transformation efforts are translating into earnings.
Potential Risks
Credit costs and loan mix remain key watch items; South Florida competition can keep deposit pricing elevated, and weaker fee income or expense slippage could quickly challenge profitability. A slowing local economy would add another risk for borrowers and sticky deposits.
Forecast
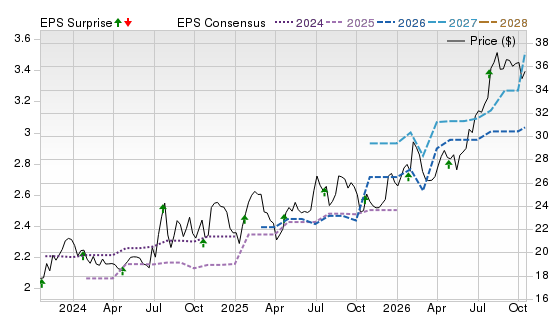
A Zacks Rank #1 supports a favorable revision setup, but Value C, Growth F, and Momentum Score D make the signal mixed. The chart shows price recovering from prior lows, 2026-2028 consensus EPS falling before stabilizing, and an uneven surprise history with a recent beat, implying improving sentiment, but little room for another setback.
This is our short term rating system that serves as a timeliness indicator for stocks over the next 1 to 3 months. How good is it? See rankings and related performance below.
The Zacks Industry Rank assigns a rating to each of the 265 X (Expanded) Industries based on their average Zacks Rank.
An industry with a larger percentage of Zacks Rank #1's and #2's will have a better average Zacks Rank than one with a larger percentage of Zacks Rank #4's and #5's.
The industry with the best average Zacks Rank would be considered the top industry (1 out of 265), which would place it in the top 1% of Zacks Ranked Industries. The industry with the worst average Zacks Rank (265 out of 265) would place in the bottom 1%.
The Zacks Sector Rank assigns a rating to each of the 16 Sectors based on their average Zacks Rank.
A sector with a larger percentage of Zacks Rank #1's and #2's will have a better average Zacks Rank than one with a larger percentage of Zacks Rank #4's and #5's.
The sector with the best average Zacks Rank would be considered the top sector (1 out of 16), which would place it in the top 1% of Zacks Ranked Sectors. The sector with the worst average Zacks Rank (16 out of 16) would place in the bottom 1%.
The Style Scores are a complementary set of indicators to use alongside the Zacks Rank. It allows the user to better focus on the stocks that are the best fit for his or her personal trading style.
The scores are based on the trading styles of Value, Growth, and Momentum. There's also a VGM Score ('V' for Value, 'G' for Growth and 'M' for Momentum), which combines the weighted average of the individual style scores into one score.
Value ScoreA
Growth ScoreA
Momentum ScoreA
VGM ScoreA
Within each Score, stocks are graded into five groups: A, B, C, D and F. As you might remember from your school days, an A, is better than a B; a B is better than a C; a C is better than a D; and a D is better than an F.
As an investor, you want to buy stocks with the highest probability of success. That means you want to buy stocks with a Zacks Rank #1 or #2, Strong Buy or Buy, which also has a Score of an A or a B in your personal trading style.
Zacks Earnings ESP (Expected Surprise Prediction) looks to find companies that have recently seen positive earnings estimate revision activity. The idea is that more recent information is, generally speaking, more accurate and can be a better predictor of the future, which can give investors an advantage in earnings season.
The technique has proven to be very useful for finding positive surprises. In fact, when combining a Zacks Rank #3 or better and a positive Earnings ESP, stocks produced a positive surprise 70% of the time, while they also saw 28.3% annual returns on average, according to our 10 year backtest.
Hancock Whitney is a Gulf Coast regional bank offering commercial, consumer, wealth, mortgage, and treasury-management services across the Southeast. The case combines a durable deposit franchise, disciplined capital returns, and strategic Florida expansion, including the pending One Florida Bank acquisition. Fee businesses and multi-quarter improvement in criticized commercial loans keep the underlying story relatively durable.
Potential Risks
Risks include Gulf Coast economic sensitivity, commercial real estate and healthcare-credit exposure, and storm-related disruption. Deposit competition, higher expenses, and a slower loan backdrop could also weigh on revenue and profitability.
Forecast
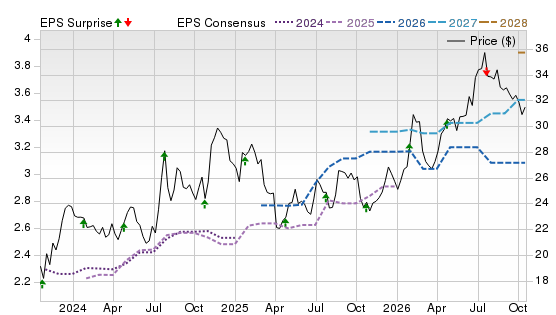
A Zacks Rank #1 is favorable, though Value C, Growth F, and Momentum F show that the scores are not universally supportive. The chart shows a strong multi-year price advance, rising 2026-2028 consensus EPS in steps, and mostly favorable surprises. Investors should watch whether estimates keep following the price higher.
This is our short term rating system that serves as a timeliness indicator for stocks over the next 1 to 3 months. How good is it? See rankings and related performance below.
The Zacks Industry Rank assigns a rating to each of the 265 X (Expanded) Industries based on their average Zacks Rank.
An industry with a larger percentage of Zacks Rank #1's and #2's will have a better average Zacks Rank than one with a larger percentage of Zacks Rank #4's and #5's.
The industry with the best average Zacks Rank would be considered the top industry (1 out of 265), which would place it in the top 1% of Zacks Ranked Industries. The industry with the worst average Zacks Rank (265 out of 265) would place in the bottom 1%.
The Zacks Sector Rank assigns a rating to each of the 16 Sectors based on their average Zacks Rank.
A sector with a larger percentage of Zacks Rank #1's and #2's will have a better average Zacks Rank than one with a larger percentage of Zacks Rank #4's and #5's.
The sector with the best average Zacks Rank would be considered the top sector (1 out of 16), which would place it in the top 1% of Zacks Ranked Sectors. The sector with the worst average Zacks Rank (16 out of 16) would place in the bottom 1%.
The Style Scores are a complementary set of indicators to use alongside the Zacks Rank. It allows the user to better focus on the stocks that are the best fit for his or her personal trading style.
The scores are based on the trading styles of Value, Growth, and Momentum. There's also a VGM Score ('V' for Value, 'G' for Growth and 'M' for Momentum), which combines the weighted average of the individual style scores into one score.
Value ScoreA
Growth ScoreA
Momentum ScoreA
VGM ScoreA
Within each Score, stocks are graded into five groups: A, B, C, D and F. As you might remember from your school days, an A, is better than a B; a B is better than a C; a C is better than a D; and a D is better than an F.
As an investor, you want to buy stocks with the highest probability of success. That means you want to buy stocks with a Zacks Rank #1 or #2, Strong Buy or Buy, which also has a Score of an A or a B in your personal trading style.
Zacks Earnings ESP (Expected Surprise Prediction) looks to find companies that have recently seen positive earnings estimate revision activity. The idea is that more recent information is, generally speaking, more accurate and can be a better predictor of the future, which can give investors an advantage in earnings season.
The technique has proven to be very useful for finding positive surprises. In fact, when combining a Zacks Rank #3 or better and a positive Earnings ESP, stocks produced a positive surprise 70% of the time, while they also saw 28.3% annual returns on average, according to our 10 year backtest.
California BanCorp is a commercially oriented California bank holding company built around relationship banking for businesses and professionals. Its appeal rests on merger scale, a strong funding base, and high core margin performance, with the latest reported quarter results showing still-solid profitability despite profit normalization from last year. Stable deposits and relationship lending give the franchise leverage to California business activity.
Potential Risks
Risks include California credit weakness, commercial real estate exposure, and potential reserve builds if nonperforming assets rise. A premium price move leaves limited room for slowing growth, credit issues, capital needs, or renewed funding-cost pressure.
Forecast
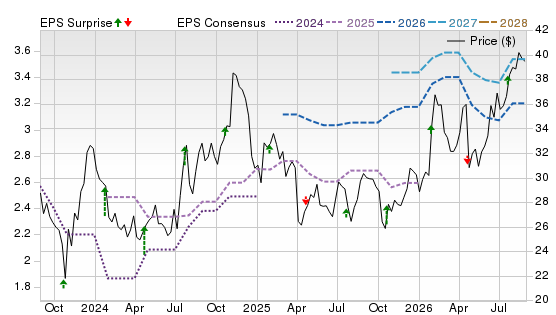
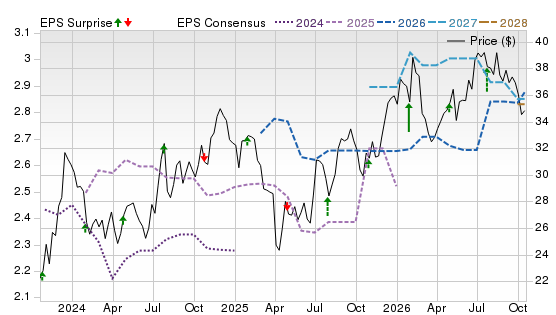
A Zacks Rank #1, Value B, and Momentum A are encouraging, while Growth F signals limited longer-term earnings acceleration in the model. The chart is supportive: price has broken to new highs, 2026-2028 EPS estimates have moved upward, and recent EPS surprises are mostly positive or near expectations, reinforcing near-term sentiment.
This is our short term rating system that serves as a timeliness indicator for stocks over the next 1 to 3 months. How good is it? See rankings and related performance below.
The Zacks Industry Rank assigns a rating to each of the 265 X (Expanded) Industries based on their average Zacks Rank.
An industry with a larger percentage of Zacks Rank #1's and #2's will have a better average Zacks Rank than one with a larger percentage of Zacks Rank #4's and #5's.
The industry with the best average Zacks Rank would be considered the top industry (1 out of 265), which would place it in the top 1% of Zacks Ranked Industries. The industry with the worst average Zacks Rank (265 out of 265) would place in the bottom 1%.
The Zacks Sector Rank assigns a rating to each of the 16 Sectors based on their average Zacks Rank.
A sector with a larger percentage of Zacks Rank #1's and #2's will have a better average Zacks Rank than one with a larger percentage of Zacks Rank #4's and #5's.
The sector with the best average Zacks Rank would be considered the top sector (1 out of 16), which would place it in the top 1% of Zacks Ranked Sectors. The sector with the worst average Zacks Rank (16 out of 16) would place in the bottom 1%.
The Style Scores are a complementary set of indicators to use alongside the Zacks Rank. It allows the user to better focus on the stocks that are the best fit for his or her personal trading style.
The scores are based on the trading styles of Value, Growth, and Momentum. There's also a VGM Score ('V' for Value, 'G' for Growth and 'M' for Momentum), which combines the weighted average of the individual style scores into one score.
Value ScoreA
Growth ScoreA
Momentum ScoreA
VGM ScoreA
Within each Score, stocks are graded into five groups: A, B, C, D and F. As you might remember from your school days, an A, is better than a B; a B is better than a C; a C is better than a D; and a D is better than an F.
As an investor, you want to buy stocks with the highest probability of success. That means you want to buy stocks with a Zacks Rank #1 or #2, Strong Buy or Buy, which also has a Score of an A or a B in your personal trading style.
Zacks Earnings ESP (Expected Surprise Prediction) looks to find companies that have recently seen positive earnings estimate revision activity. The idea is that more recent information is, generally speaking, more accurate and can be a better predictor of the future, which can give investors an advantage in earnings season.
The technique has proven to be very useful for finding positive surprises. In fact, when combining a Zacks Rank #3 or better and a positive Earnings ESP, stocks produced a positive surprise 70% of the time, while they also saw 28.3% annual returns on average, according to our 10 year backtest.
Investar Holding is a Baton Rouge-based community bank serving Louisiana, Texas, and Alabama through commercial and consumer banking. Its appeal is scale-led: the Wichita Falls Bancshares deal expanded Texas reach, loans, and deposits, while recent results showed stronger earnings and margins, providing greater operating leverage and a broader relationship-growth platform.
Potential Risks
Key risks include integration execution, acquired-loan quality, and tangible book value dilution. While scale may boost efficiency, it also adds operational complexity and greater exposure to regional energy, real estate, and economic cycles.
Forecast
A Zacks Rank #2 (Buy) remains positive, while Value C, Growth D, and Momentum B point to moderate, momentum-led appeal rather than a clean value or growth case. The chart shows a powerful price recovery, a step-up in 2026-2028 consensus EPS followed by some recent softening, and generally positive surprises. The implication is optimism, but execution missteps could reset expectations.
The Zacks Rank is a proprietary stock-rating model that uses trends in earnings estimate revisions and earnings-per-share (EPS) surprises to classify stocks into five groups: #1 (Strong Buy), #2 (Buy), #3 (Hold), #4 (Sell) and #5 (Strong Sell). The Zacks Rank is calculated through four primary factors related to earnings estimates: analysts' consensus on earnings estimate revisions, the magnitude of revision change, the upside potential and estimate surprise (or the degree in which earnings per share deviated from the previous quarter).
Zacks builds the data from 3,000 analysts at over 150 different brokerage firms. The average yearly gain for Zacks Rank #1 (Strong Buy) stocks is +24.00% per year from January, 1988, through May 4, 2026.
Selections for Best Banks Stocks are based on the current top ranking stocks based on Zacks Indicator Score, Style Scores and fundamentals. All stocks have a daily trading volume of at least 100,000 shares and have a stock price of at least $5. All information is current as of market open, June 30, 2026.
General Questions about Bank Stocks
What are Bank Stocks
Bank stocks represent ownership shares in publicly traded banking institutions. These companies generate revenue by accepting deposits, issuing loans, earning interest income, charging fees, and offering financial products such as credit cards, wealth management, and investment services.
Investors often buy bank stocks for a combination of:
Dividend income.
Long-term growth potential.
Exposure to economic expansion.
Relative value compared with other sectors.
Because banks are closely tied to economic activity, their stock performance often reflects broader trends in lending, consumer spending, business investment, and interest rates.
Types of Bank Stocks
Bank stocks generally fall into four major categories.
National Banks
National banks are large financial institutions with operations across the country and often around the world. They typically serve consumers, businesses, corporations, and institutional clients.
These banks tend to have diversified revenue streams across consumer banking, credit cards, investment banking, and wealth management.
Examples include:
JPMorgan Chase (JPM).
Bank of America (BAC).
Wells Fargo (WFC).
Citigroup (C).
National banks are often viewed as the safest bank stocks because of their size and diversification.
Regional Banks
Regional banks operate in specific geographic markets or across several states. They usually focus more heavily on commercial lending, residential mortgages, and small business banking.
These banks can offer stronger growth potential than larger banks but often carry more concentration risk.
Examples include:
PNC Financial Services (PNC).
Truist Financial (TFC).
Fifth Third Bancorp (FITB).
Regions Financial (RF).
Regional banks are often more sensitive to commercial real estate and local economic conditions.
Investment Banks
Investment banks primarily serve corporations, institutions, and governments rather than retail consumers. Their revenue comes largely from advisory services, underwriting, mergers and acquisitions, trading, and asset management.
These banks are more dependent on capital markets activity than interest income.
Examples include:
Goldman Sachs (GS).
Morgan Stanley (MS).
Investment banks can perform particularly well during periods of strong IPO, M&A, and trading activity.
Community Banks
Community banks are smaller institutions focused on local markets. They typically serve individuals, small businesses, and local commercial borrowers.
These banks often build strong customer relationships and may provide more personalized service.
Examples include:
Bank OZK (OZK).
Independent Bank Corp (INDB).
First Financial Bankshares (FFIN).
Community banks can provide attractive dividends, though their stocks may be less liquid than larger banks.
What are the benefits of buying bank stocks?
Bank stocks offer several advantages for long-term investors.
Benefits include:
Dividend income.
Attractive valuations.
Exposure to economic growth.
Potential share buybacks.
Long-term earnings growth.
Many bank stocks also trade at lower valuation multiples than technology or growth stocks, making them appealing to value investors.
What are the risks of buying bank stocks?
Bank stocks also carry important risks.
Major risks include:
Recession risk.
Credit losses.
Regulatory changes.
Loan growth slowdowns.
Commercial real estate exposure.
Interest rate volatility.
Bank earnings can weaken quickly when economic conditions deteriorate.
Are regional bank stocks better than big banks?
Neither category is automatically better—it depends on your goals and risk tolerance.
Regional banks may offer:
Higher growth potential.
Lower valuations.
Stronger dividend yields.
Large banks may offer:
Better diversification.
Stronger balance sheets.
More stable earnings.
Regional banks often carry greater risk but may also offer greater upside during economic recoveries.
How to Evaluate Bank Stocks
How do I check a bank's financial health?
Key financial indicators include:
Capital ratios.
Deposit growth.
Loan quality.
Profitability metrics.
Credit loss trends.
Strong banks typically show stable earnings, manageable loan losses, and solid capital reserves.
How do falling interest rates affect bank stock prices?
Lower interest rates can reduce bank profitability because lending spreads often shrink.
However, falling rates may also:
Improve loan demand.
Lower borrower defaults.
Reduce recession risk.
The impact depends heavily on the bank’s funding mix and loan portfolio.
What is a good Price-to-Book (P/B) ratio for a bank?
Price-to-book is one of the most widely used valuation metrics for bank stocks.
General guidelines:
Below 1.0 may indicate undervaluation.
Around 1.0–1.5 is common for many banks.
Above 2.0 often reflects premium valuation.
High-quality banks with strong profitability usually trade at higher P/B multiples.
How does the yield curve affect bank profitability?
Banks generally borrow short-term and lend long-term.
A steeper yield curve allows banks to earn wider spreads between borrowing and lending rates.
This usually improves profitability.
An inverted yield curve can pressure earnings by shrinking those spreads.
What is a bank's Efficiency Ratio?
The efficiency ratio measures operating expenses as a percentage of revenue.
It helps investors assess cost efficiency.
General guidelines:
Below 60% is strong.
60%–70% is average.
Above 70% may indicate inefficiency.
Lower ratios usually signal better management execution.
What is the Net Interest Margin (NIM) trend for this bank?
Net Interest Margin measures how efficiently a bank earns interest income from loans relative to what it pays depositors and other funding sources.
A rising NIM usually signals improving profitability.
A declining NIM may indicate pressure from falling rates or higher funding costs.
Because NIM is a major profit driver, investors should monitor it closely.
What is the CET1 Ratio?
The Common Equity Tier 1 (CET1) ratio measures a bank’s core capital strength relative to its risk-weighted assets.
In simple terms, CET1 shows how much high-quality capital a bank has available to absorb losses during financial stress.
CET1 capital includes:
Common shares.
Retained earnings.
Other comprehensive income.
Regulators use CET1 as one of the most important safety metrics for banks.
General guidelines:
Above 10% is generally strong.
12% or higher often indicates a highly capitalized bank.
Lower CET1 ratios may signal greater vulnerability during economic downturns.
For example, if a bank experiences heavy loan losses during a recession, a strong CET1 ratio helps ensure it can absorb those losses without threatening solvency.
Large banks with strong CET1 ratios are usually viewed as safer investments.
What is the Provision for Credit Losses (PCL)?
Provision for Credit Losses (PCL) is the amount a bank sets aside to prepare for expected loan defaults.
Think of PCL as a financial cushion against borrowers failing to repay loans.
Banks typically increase PCL when they expect:
Rising unemployment.
Economic slowdown.
Higher consumer defaults.
Greater corporate loan risk.
A rising PCL can be an early warning sign that management expects worsening credit conditions.
A stable or declining PCL often suggests:
Healthy borrowers.
Stable economic conditions.
Improving credit quality.
For investors, PCL is important because it directly affects earnings. Higher provisions reduce short-term profits but can protect the bank against future losses.
Watching PCL trends over several quarters can reveal whether credit risk is improving or deteriorating.