We use cookies to understand how you use our site and to improve your experience.
This includes personalizing content and advertising.
By pressing "Accept All" or closing out of this banner, you consent to the use of all cookies and similar technologies and the sharing of information they collect with third parties.
You can reject marketing cookies by pressing "Deny Optional," but we still use essential, performance, and functional cookies.
In addition, whether you "Accept All," Deny Optional," click the X or otherwise continue to use the site, you accept our Privacy Policy and Terms of Service, revised from time to time.
You are being directed to ZacksTrade, a division of LBMZ Securities and licensed broker-dealer. ZacksTrade and Zacks.com are separate companies. The web link between the two companies is not a solicitation or offer to invest in a particular security or type of security. ZacksTrade does not endorse or adopt any particular investment strategy, any analyst opinion/rating/report or any approach to evaluating individual securities.
If you wish to go to ZacksTrade, click OK. If you do not, click Cancel.
Mining stocks can be appealing because they provide direct exposure to global demand for raw materials.
Mining companies, however, are highly sensitive to fluctuations in metal prices and geopolitical forces.
Among the best mining stocks to buy now are Pan American Silver, Idaho Strategic Resources and Aura Minerals.
Mining stocks allow investors to gain exposure to companies that extract essential natural resources such as gold, copper, iron ore, and lithium. These raw materials sit at the foundation of modern economies, supporting infrastructure development, power generation, manufacturing, and a wide range of modern technologies.
Some of the world’s largest mining companies include BHP Group, Rio Tinto, and Vale S.A.. These companies operate mines across multiple continents and produce a range of commodities including iron ore, copper, aluminum, and nickel.
Other major players specialize in particular metals, such as gold producer Newmont Corporation (NEM) or copper-focused miner Freeport-McMoRan (FCX).
Because commodity demand fluctuates with economic cycles, mining stocks can deliver significant returns during commodity booms but can also experience sharp declines during downturns.
Are mining stocks a good investment?
Mining stocks can be appealing because they provide direct exposure to global demand for raw materials. Metals like copper, iron ore, and lithium are essential for construction, renewable energy infrastructure, and electronics manufacturing.
Large diversified miners such as BHP Group (BHP) and Rio Tinto (RIO) benefit from global commodity demand and typically generate strong cash flow when commodity prices are strong, since higher prices can translate into substantial cash flow and shareholder returns.
However, the mining sector carries notable risks. Mining companies are highly sensitive to fluctuations in metal prices, geopolitical developments, and rising production costs. When commodity prices fall, profits and share prices can decline quickly.
For investors who understand commodity cycles and diversify across several companies, mining stocks can play an important role in a long-term investment portfolio.
Below, we examine and rank leading mining stocks using a blend of Zacks Rank signals, Style Scores, and core fundamental metrics to identify companies that may offer compelling long-term opportunities for investors.
This is our short term rating system that serves as a timeliness indicator for stocks over the next 1 to 3 months. How good is it? See rankings and related performance below.
The Zacks Industry Rank assigns a rating to each of the 265 X (Expanded) Industries based on their average Zacks Rank.
An industry with a larger percentage of Zacks Rank #1's and #2's will have a better average Zacks Rank than one with a larger percentage of Zacks Rank #4's and #5's.
The industry with the best average Zacks Rank would be considered the top industry (1 out of 265), which would place it in the top 1% of Zacks Ranked Industries. The industry with the worst average Zacks Rank (265 out of 265) would place in the bottom 1%.
The Zacks Sector Rank assigns a rating to each of the 16 Sectors based on their average Zacks Rank.
A sector with a larger percentage of Zacks Rank #1's and #2's will have a better average Zacks Rank than one with a larger percentage of Zacks Rank #4's and #5's.
The sector with the best average Zacks Rank would be considered the top sector (1 out of 16), which would place it in the top 1% of Zacks Ranked Sectors. The sector with the worst average Zacks Rank (16 out of 16) would place in the bottom 1%.
The Style Scores are a complementary set of indicators to use alongside the Zacks Rank. It allows the user to better focus on the stocks that are the best fit for his or her personal trading style.
The scores are based on the trading styles of Value, Growth, and Momentum. There's also a VGM Score ('V' for Value, 'G' for Growth and 'M' for Momentum), which combines the weighted average of the individual style scores into one score.
Value ScoreA
Growth ScoreA
Momentum ScoreA
VGM ScoreA
Within each Score, stocks are graded into five groups: A, B, C, D and F. As you might remember from your school days, an A, is better than a B; a B is better than a C; a C is better than a D; and a D is better than an F.
As an investor, you want to buy stocks with the highest probability of success. That means you want to buy stocks with a Zacks Rank #1 or #2, Strong Buy or Buy, which also has a Score of an A or a B in your personal trading style.
Zacks Earnings ESP (Expected Surprise Prediction) looks to find companies that have recently seen positive earnings estimate revision activity. The idea is that more recent information is, generally speaking, more accurate and can be a better predictor of the future, which can give investors an advantage in earnings season.
The technique has proven to be very useful for finding positive surprises. In fact, when combining a Zacks Rank #3 or better and a positive Earnings ESP, stocks produced a positive surprise 70% of the time, while they also saw 28.3% annual returns on average, according to our 10 year backtest.
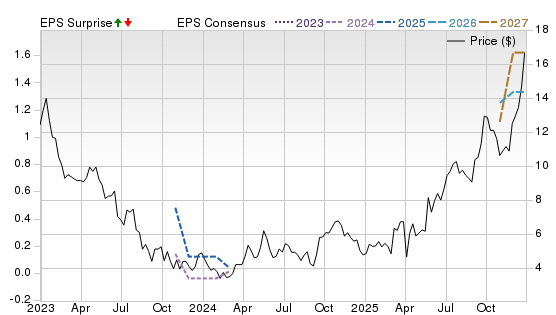
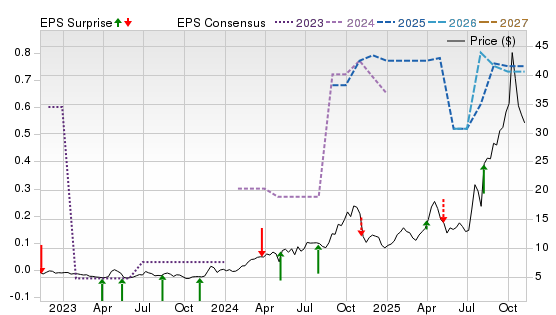
Pan American Silver is a long-established mining company that produces silver and gold across the Americas. It operates 10 active mines and holds large reserves of both metals. Growth is supported by high-quality assets like Juanicipio, a large, low-cost silver mine. The company also expects higher silver production in 2026, which supports stronger future output and long-term growth potential.
Potential Risks
The business depends on smooth operations across several countries. Changes in government rules, delays in permits, local issues, or declining mine resources could affect production and overall performance.
Forecast
A Zacks Rank #1 (Strong Buy) with a B for Growth suggests rising estimates, even if Value and Momentum Scores are C. The Price, Consensus & EPS Surprise chart shows 2025–2027 EPS expectations stepping higher and a largely positive surprise streak since 2024, supporting further revisions if metals hold and mines stay on plan.
This is our short term rating system that serves as a timeliness indicator for stocks over the next 1 to 3 months. How good is it? See rankings and related performance below.
The Zacks Industry Rank assigns a rating to each of the 265 X (Expanded) Industries based on their average Zacks Rank.
An industry with a larger percentage of Zacks Rank #1's and #2's will have a better average Zacks Rank than one with a larger percentage of Zacks Rank #4's and #5's.
The industry with the best average Zacks Rank would be considered the top industry (1 out of 265), which would place it in the top 1% of Zacks Ranked Industries. The industry with the worst average Zacks Rank (265 out of 265) would place in the bottom 1%.
The Zacks Sector Rank assigns a rating to each of the 16 Sectors based on their average Zacks Rank.
A sector with a larger percentage of Zacks Rank #1's and #2's will have a better average Zacks Rank than one with a larger percentage of Zacks Rank #4's and #5's.
The sector with the best average Zacks Rank would be considered the top sector (1 out of 16), which would place it in the top 1% of Zacks Ranked Sectors. The sector with the worst average Zacks Rank (16 out of 16) would place in the bottom 1%.
The Style Scores are a complementary set of indicators to use alongside the Zacks Rank. It allows the user to better focus on the stocks that are the best fit for his or her personal trading style.
The scores are based on the trading styles of Value, Growth, and Momentum. There's also a VGM Score ('V' for Value, 'G' for Growth and 'M' for Momentum), which combines the weighted average of the individual style scores into one score.
Value ScoreA
Growth ScoreA
Momentum ScoreA
VGM ScoreA
Within each Score, stocks are graded into five groups: A, B, C, D and F. As you might remember from your school days, an A, is better than a B; a B is better than a C; a C is better than a D; and a D is better than an F.
As an investor, you want to buy stocks with the highest probability of success. That means you want to buy stocks with a Zacks Rank #1 or #2, Strong Buy or Buy, which also has a Score of an A or a B in your personal trading style.
Zacks Earnings ESP (Expected Surprise Prediction) looks to find companies that have recently seen positive earnings estimate revision activity. The idea is that more recent information is, generally speaking, more accurate and can be a better predictor of the future, which can give investors an advantage in earnings season.
The technique has proven to be very useful for finding positive surprises. In fact, when combining a Zacks Rank #3 or better and a positive Earnings ESP, stocks produced a positive surprise 70% of the time, while they also saw 28.3% annual returns on average, according to our 10 year backtest.
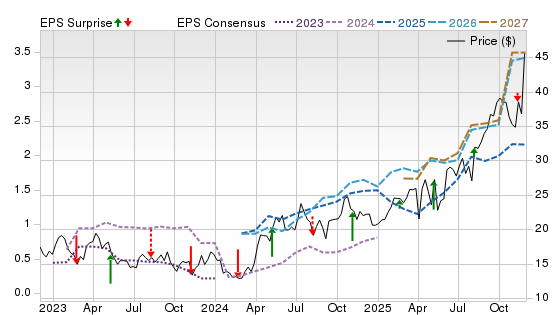
Aura Minerals is a diversified gold and copper producer with a growing portfolio of operating and development assets across the Americas. The company operates six mines and continues to expand through disciplined capital allocation, strong free cash flow generation, and low leverage. It has delivered consistent production growth, improved reserves, and meaningful shareholder returns through dividends and buybacks while advancing multiple high-return growth projects.
Potential Risks
Limited asset diversification increases exposure to operational disruptions. Rising costs, grade variability, and execution risks in development projects, along with commodity price volatility, may pressure margins and cash flows.
Forecast
A Zacks Rank #1 and an A Growth Score suggest estimate revisions are supportive, even with C for Value and Momentum. The chart shows 2026–2027 EPS expectations ramping higher and recent surprises leaning positive, supporting more upside revisions if volumes stay strong.
This is our short term rating system that serves as a timeliness indicator for stocks over the next 1 to 3 months. How good is it? See rankings and related performance below.
The Zacks Industry Rank assigns a rating to each of the 265 X (Expanded) Industries based on their average Zacks Rank.
An industry with a larger percentage of Zacks Rank #1's and #2's will have a better average Zacks Rank than one with a larger percentage of Zacks Rank #4's and #5's.
The industry with the best average Zacks Rank would be considered the top industry (1 out of 265), which would place it in the top 1% of Zacks Ranked Industries. The industry with the worst average Zacks Rank (265 out of 265) would place in the bottom 1%.
The Zacks Sector Rank assigns a rating to each of the 16 Sectors based on their average Zacks Rank.
A sector with a larger percentage of Zacks Rank #1's and #2's will have a better average Zacks Rank than one with a larger percentage of Zacks Rank #4's and #5's.
The sector with the best average Zacks Rank would be considered the top sector (1 out of 16), which would place it in the top 1% of Zacks Ranked Sectors. The sector with the worst average Zacks Rank (16 out of 16) would place in the bottom 1%.
The Style Scores are a complementary set of indicators to use alongside the Zacks Rank. It allows the user to better focus on the stocks that are the best fit for his or her personal trading style.
The scores are based on the trading styles of Value, Growth, and Momentum. There's also a VGM Score ('V' for Value, 'G' for Growth and 'M' for Momentum), which combines the weighted average of the individual style scores into one score.
Value ScoreA
Growth ScoreA
Momentum ScoreA
VGM ScoreA
Within each Score, stocks are graded into five groups: A, B, C, D and F. As you might remember from your school days, an A, is better than a B; a B is better than a C; a C is better than a D; and a D is better than an F.
As an investor, you want to buy stocks with the highest probability of success. That means you want to buy stocks with a Zacks Rank #1 or #2, Strong Buy or Buy, which also has a Score of an A or a B in your personal trading style.
Zacks Earnings ESP (Expected Surprise Prediction) looks to find companies that have recently seen positive earnings estimate revision activity. The idea is that more recent information is, generally speaking, more accurate and can be a better predictor of the future, which can give investors an advantage in earnings season.
The technique has proven to be very useful for finding positive surprises. In fact, when combining a Zacks Rank #3 or better and a positive Earnings ESP, stocks produced a positive surprise 70% of the time, while they also saw 28.3% annual returns on average, according to our 10 year backtest.
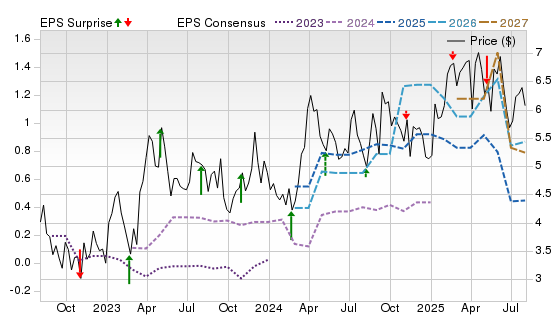
Idaho Strategic Resources is a U.S.-based mining company focused on gold and critical minerals. Its Golden Chest Mine, the largest gold producer in Idaho, generates steady output and cash flow that helps fund new exploration. The company is expanding drilling, adding new projects, and building a mill to cut costs, giving it room to grow production and improve profitability over time.
Potential Risks
Operations rely on a single producing asset and historic resource estimates that are not current. Exploration outcomes, permitting, and development plans remain uncertain, and forward-looking assumptions may not materialize fully.
Forecast
A Zacks Rank #1 points to supportive revisions, and the Style Scores of B for Momentum and Growth fit improving fundamentals, but the Value Score of F flags valuation risk. The chart shows EPS expectations stepping up into 2025–2026 with several beats yet notable estimate volatility, so consistency is key.
This is our short term rating system that serves as a timeliness indicator for stocks over the next 1 to 3 months. How good is it? See rankings and related performance below.
The Zacks Industry Rank assigns a rating to each of the 265 X (Expanded) Industries based on their average Zacks Rank.
An industry with a larger percentage of Zacks Rank #1's and #2's will have a better average Zacks Rank than one with a larger percentage of Zacks Rank #4's and #5's.
The industry with the best average Zacks Rank would be considered the top industry (1 out of 265), which would place it in the top 1% of Zacks Ranked Industries. The industry with the worst average Zacks Rank (265 out of 265) would place in the bottom 1%.
The Zacks Sector Rank assigns a rating to each of the 16 Sectors based on their average Zacks Rank.
A sector with a larger percentage of Zacks Rank #1's and #2's will have a better average Zacks Rank than one with a larger percentage of Zacks Rank #4's and #5's.
The sector with the best average Zacks Rank would be considered the top sector (1 out of 16), which would place it in the top 1% of Zacks Ranked Sectors. The sector with the worst average Zacks Rank (16 out of 16) would place in the bottom 1%.
The Style Scores are a complementary set of indicators to use alongside the Zacks Rank. It allows the user to better focus on the stocks that are the best fit for his or her personal trading style.
The scores are based on the trading styles of Value, Growth, and Momentum. There's also a VGM Score ('V' for Value, 'G' for Growth and 'M' for Momentum), which combines the weighted average of the individual style scores into one score.
Value ScoreA
Growth ScoreA
Momentum ScoreA
VGM ScoreA
Within each Score, stocks are graded into five groups: A, B, C, D and F. As you might remember from your school days, an A, is better than a B; a B is better than a C; a C is better than a D; and a D is better than an F.
As an investor, you want to buy stocks with the highest probability of success. That means you want to buy stocks with a Zacks Rank #1 or #2, Strong Buy or Buy, which also has a Score of an A or a B in your personal trading style.
Zacks Earnings ESP (Expected Surprise Prediction) looks to find companies that have recently seen positive earnings estimate revision activity. The idea is that more recent information is, generally speaking, more accurate and can be a better predictor of the future, which can give investors an advantage in earnings season.
The technique has proven to be very useful for finding positive surprises. In fact, when combining a Zacks Rank #3 or better and a positive Earnings ESP, stocks produced a positive surprise 70% of the time, while they also saw 28.3% annual returns on average, according to our 10 year backtest.
Impala Platinum is a leading producer and refiner of platinum-group metals with integrated operations across mining and processing. The company delivered improved earnings and cash generation in the latest reporting period, strengthening its balance sheet and liquidity position. This resilience supports shareholder returns and positions the business to sustain capital investment and operational stability through commodity cycles.
Potential Risks
Earnings remain exposed to fluctuations in platinum group metals prices and demand conditions. Operational challenges, including power supply constraints and cost pressures, could impact production efficiency and profitability.
Forecast
A Zacks Rank #1 and an A Momentum Score point to supportive revisions and price action, but D scores for Value and Growth suggest less margin for error. The chart shows forward EPS expectations jumping into 2026–2027, so the next few reports will likely determine whether estimates keep rising.
This is our short term rating system that serves as a timeliness indicator for stocks over the next 1 to 3 months. How good is it? See rankings and related performance below.
The Zacks Industry Rank assigns a rating to each of the 265 X (Expanded) Industries based on their average Zacks Rank.
An industry with a larger percentage of Zacks Rank #1's and #2's will have a better average Zacks Rank than one with a larger percentage of Zacks Rank #4's and #5's.
The industry with the best average Zacks Rank would be considered the top industry (1 out of 265), which would place it in the top 1% of Zacks Ranked Industries. The industry with the worst average Zacks Rank (265 out of 265) would place in the bottom 1%.
The Zacks Sector Rank assigns a rating to each of the 16 Sectors based on their average Zacks Rank.
A sector with a larger percentage of Zacks Rank #1's and #2's will have a better average Zacks Rank than one with a larger percentage of Zacks Rank #4's and #5's.
The sector with the best average Zacks Rank would be considered the top sector (1 out of 16), which would place it in the top 1% of Zacks Ranked Sectors. The sector with the worst average Zacks Rank (16 out of 16) would place in the bottom 1%.
The Style Scores are a complementary set of indicators to use alongside the Zacks Rank. It allows the user to better focus on the stocks that are the best fit for his or her personal trading style.
The scores are based on the trading styles of Value, Growth, and Momentum. There's also a VGM Score ('V' for Value, 'G' for Growth and 'M' for Momentum), which combines the weighted average of the individual style scores into one score.
Value ScoreA
Growth ScoreA
Momentum ScoreA
VGM ScoreA
Within each Score, stocks are graded into five groups: A, B, C, D and F. As you might remember from your school days, an A, is better than a B; a B is better than a C; a C is better than a D; and a D is better than an F.
As an investor, you want to buy stocks with the highest probability of success. That means you want to buy stocks with a Zacks Rank #1 or #2, Strong Buy or Buy, which also has a Score of an A or a B in your personal trading style.
Zacks Earnings ESP (Expected Surprise Prediction) looks to find companies that have recently seen positive earnings estimate revision activity. The idea is that more recent information is, generally speaking, more accurate and can be a better predictor of the future, which can give investors an advantage in earnings season.
The technique has proven to be very useful for finding positive surprises. In fact, when combining a Zacks Rank #3 or better and a positive Earnings ESP, stocks produced a positive surprise 70% of the time, while they also saw 28.3% annual returns on average, according to our 10 year backtest.
Equinox Gold is an Americas-focused gold producer with a diversified portfolio anchored in North America. The company delivered record annual production of 922,827 ounces in 2025 and significantly reduced net debt to about $75 million, strengthening its balance sheet. With 2026 production guidance of 700,000 to 800,000 ounces and a pipeline offering over 500,000 ounces of potential growth, it is positioned for strong output expansion and cash flow improvement.
Potential Risks
Execution depends on timely ramp-up at Greenstone and Valentine and successful project expansions. Delays, cost overruns, permitting challenges, or operational disruptions could impact production targets and financial performance.
Forecast
A Zacks Rank #2 (Buy) with an A Growth Score and B Momentum suggests supportive revisions, even with a C Value Score. The chart shows 2026–2027 EPS expectations climbing, but 2025 lines are choppy with mixed surprises, so steadier beats and guidance matter most.
The Zacks Rank is a proprietary stock-rating model that uses trends in earnings estimate revisions and earnings-per-share (EPS) surprises to classify stocks into five groups: #1 (Strong Buy), #2 (Buy), #3 (Hold), #4 (Sell) and #5 (Strong Sell). The Zacks Rank is calculated through four primary factors related to earnings estimates: analysts' consensus on earnings estimate revisions, the magnitude of revision change, the upside potential and estimate surprise (or the degree in which earnings per share deviated from the previous quarter).
Zacks builds the data from 3,000 analysts at over 150 different brokerage firms. The average yearly gain for Zacks Rank #1 (Strong Buy) stocks is +23.62% per year from January, 1988, through June 2, 2025.
Selections for Best Mining Stocks are based on the current top ranking stocks based on Zacks Indicator Score, Style Scores and fundamentals. All stocks have a daily trading volume of at least 100,000 shares and have a stock price of at least $5. All information is current as of market open, April 2, 2026.
Understanding mining stocks
What are the benefits of buying mining stocks?
Mining stocks offer several advantages:
Exposure to global commodity demand. Metals such as copper, lithium, and iron ore are essential for modern infrastructure and technology.
Leverage to commodity price increases. When metal prices rise, mining company profits often grow faster than the commodity itself.
Dividend income. Major producers like Rio Tinto (RIO) and BHP Group (BHP) regularly return profits to shareholders through dividends.
Diversification benefits. Commodity stocks often behave differently than sectors like technology or consumer goods.
Mining companies can also benefit from long-term trends such as electrification, renewable energy expansion, and increasing global infrastructure development.
What are the risks of buying mining stocks?
Mining companies face several unique risks:
Commodity price volatility. Metals like gold, copper, and iron ore can fluctuate dramatically in price.
Operational challenges. Mines require heavy equipment, skilled labor, and complex logistics.
Political and regulatory risks. Mining operations often take place in countries with changing tax laws or regulations.
High capital requirements. Building and maintaining mines requires large investments.
For example, copper giant Freeport-McMoRan (FCX) operates large mines around the world that are influenced by international regulations and commodity cycles.
Are mining stocks a good hedge against inflation or economic downturns?
Certain mining stocks—especially gold miners—are often considered inflation hedges.
When inflation rises or financial markets become volatile, investors frequently turn to gold. Companies like Newmont Corporation (NEM) and Barrick Gold (B) may benefit from rising gold prices during uncertain economic periods.
Industrial metals tend to behave differently. Demand for copper and steel often increases during periods of economic growth but can weaken during recessions.
Because of this dynamic, mining stocks can serve both as cyclical growth investments and defensive holdings depending on the commodity involved.
Mining stocks vs Mining ETFs
Investors can gain exposure to mining through individual companies or exchange-traded funds.
Mining stocks
Advantages:
Potential for higher returns if a specific company performs well.
Ability to target specific commodities.
Disadvantages:
Greater company-specific risk.
Mining ETFs
Advantages:
Diversification across dozens of mining companies.
Lower risk from operational problems at a single mine.
Mining ETFs typically include companies such as Anglo American plc, Glencore plc, and Teck Resources (TECK).
How do I evaluate a mining stock before investing?
Evaluating mining stocks requires examining both financial data and the quality of the company’s mineral reserves.
What metrics should I look at when comparing mining stocks?
Important metrics include:
All-in sustaining costs (AISC). This shows how much it costs a company to produce each ounce or ton of metal.
Proven and probable reserves. These determine how long a mine can operate.
Free cash flow. Strong cash flow often indicates efficient operations.
Debt levels. Excessive debt can become risky during commodity downturns.
Valuation ratios. Price-to-earnings and price-to-cash-flow ratios help compare companies.
Large diversified miners such as Vale S.A. (VALE) and BHP Group (BHP) often stand out due to their scale and cash generation.
Which metals or commodities should I focus on?
Different metals serve different economic roles:
Precious metals: Gold and silver miners such as Newmont Corporation (NEM) and Pan American Silver (PAAS).
Industrial metals: Copper producers like Freeport-McMoRan (FCX) and Southern Copper (SCCO).
Bulk materials: Iron ore producers such as Vale S.A. (VALE).
Battery metals: Lithium and nickel companies supporting electric vehicles and renewable energy.
Copper and lithium are increasingly popular among investors due to the global energy transition.
Should I invest in large miners or junior/exploration miners?
Mining companies typically fall into two main categories.
Large-cap miners
Examples include BHP Group and Rio Tinto.
Advantages:
Diversified production
Stable revenue
Dividend payments
Junior mining companies
These smaller companies focus on discovering new mineral deposits. Some may eventually become major producers if they successfully develop a new mine.
Advantages:
Potential for significant gains if a major discovery occurs.
Risks:
Many exploration projects never reach commercial production.
How do I know if a mining stock is undervalued or overpriced?
Investors often compare a company’s market value with the estimated value of its mineral reserves and production capacity.
Possible signs of undervaluation include:
Large reserves with relatively low market capitalization.
Rising commodity prices.
Declining production costs.
New exploration discoveries.
If copper demand increases globally, for example, producers like Freeport-McMoRan or Southern Copper may see their valuations rise.
What are the red flags when investing in a mining stock?
Investors should watch for warning signs such as:
High debt levels.
Frequent stock dilution from issuing new shares.
Declining ore grades or shrinking reserves.
Political risk in unstable regions.
Repeated delays in developing new projects.
These issues can significantly reduce long-term returns.
Strategy and Portfolio Building with Mining Stocks
How much of my portfolio should I allocate to mining stocks?
Many financial experts recommend limiting commodity exposure to a modest portion of a diversified portfolio.
A common guideline is 5% to 15% of total investments, depending on an investor’s risk tolerance and outlook for commodity markets.
This allocation allows investors to benefit from commodity cycles without exposing their entire portfolio to volatility.
Should I diversify across metals or focus on one commodity?
Diversifying across multiple commodities can help reduce risk.
For example, investors might combine holdings in:
Newmont Corporation (gold)
Freeport-McMoRan (copper)
Vale S.A. (iron ore)
Holding companies tied to different metals can help balance cyclical swings in commodity prices.
How do I hedge risk when investing in mining stocks?
Investors often manage risk through:
Commodity diversification across different metals
Position sizing to limit exposure to volatile companies
Combining large and small mining companies
Using ETFs alongside individual stocks
Because mining profits depend heavily on global economic demand, investors should monitor macroeconomic trends closely.
When should I sell if a mining stock spikes after a discovery?
Junior mining companies sometimes surge after announcing a new mineral discovery.
Many investors lock in gains by selling part of their holdings after a significant price spike while keeping a smaller position in case the project develops into a producing mine.
This approach helps balance potential long-term upside with risk management.
Are dividend-paying miners better for long-term growth?
Dividend-paying mining companies can offer both income and capital appreciation.
Large diversified producers like Rio Tinto and BHP Group often distribute excess profits to shareholders during strong commodity cycles.
While dividend payouts can fluctuate with commodity prices, these companies tend to be more stable than smaller exploration firms.
Bottom Line
Mining stocks offer investors exposure to companies that produce the raw materials that power global growth. Demand for metals used in infrastructure, technology, and clean energy continues to shape long-term commodity markets.
By focusing on mining companies with strong reserves, disciplined cost structures, and diversified operations, investors can potentially benefit from rising commodity demand while reducing some of the volatility that often accompanies the sector.


 Hold
Hold 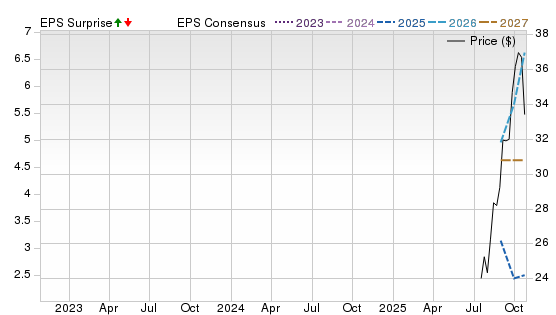
 Strong Buy