We use cookies to understand how you use our site and to improve your experience.
This includes personalizing content and advertising.
By pressing "Accept All" or closing out of this banner, you consent to the use of all cookies and similar technologies and the sharing of information they collect with third parties.
You can reject marketing cookies by pressing "Deny Optional," but we still use essential, performance, and functional cookies.
In addition, whether you "Accept All," Deny Optional," click the X or otherwise continue to use the site, you accept our Privacy Policy and Terms of Service, revised from time to time.
You are being directed to ZacksTrade, a division of LBMZ Securities and licensed broker-dealer. ZacksTrade and Zacks.com are separate companies. The web link between the two companies is not a solicitation or offer to invest in a particular security or type of security. ZacksTrade does not endorse or adopt any particular investment strategy, any analyst opinion/rating/report or any approach to evaluating individual securities.
If you wish to go to ZacksTrade, click OK. If you do not, click Cancel.
Earnings per share, or EPS, is one of the most widely used indicators of a company’s profitability.
High EPS can be an attractive signal, but on its own doesn't make a compelling investment.
Stocks to buy with the best EPS trends include Marathon Petroleum, Charles Schwab and Enterprise Products.
Earnings per share, or EPS, remains one of the most widely used indicators of a company’s profitability and financial health. Investors screening for high EPS stocks are generally seeking businesses with strong earnings power, consistent growth, and the ability to deliver returns that outpace the broader market.
In 2026, opportunities tied to robust EPS are appearing across a range of sectors, including technology, consumer staples, and industrials. Many of these candidates are large, established companies with proven earnings strength, alongside select growth names that may still be undervalued relative to their profit potential.
Is it good to invest in high EPS stocks?
High EPS can be an attractive signal because it reflects a company’s ability to generate meaningful profits relative to its share count. Businesses with expanding earnings often benefit from solid fundamentals, healthy cash flow, and greater flexibility to reinvest in operations or return capital to shareholders through dividends and buybacks.
However, EPS on its own does not make a stock a compelling investment. A company can report strong earnings while still trading at an excessive valuation or facing headwinds that could limit future growth.
What is a good EPS for stocks?
There is no single benchmark that defines a good EPS. Instead, investors typically assess it in context, focusing on several key factors.
Industry comparisons (tech vs. utilities, for example). Different sectors operate under distinct cost structures and growth expectations, so benchmarking EPS against direct peers provides a more meaningful measure of performance.
Growth trends over time. A steadily rising EPS is often more valuable than a high but flat figure, as it reflects improving profitability and supports long-term compounding potential.
Consistency of earnings. Companies that deliver reliable results across multiple periods tend to carry lower risk than those with volatile or uneven earnings profiles.
Valuation ratios like P/E. EPS should always be assessed alongside valuation to avoid overpaying for earnings that may already be fully reflected in the stock price.
In practice, a “good” EPS is less about the absolute number and more about the trajectory, stability, and relative strength of a company’s earnings.
Below, we examine and rank the best EPS stocks using historical results, projected earnings growth, and a combination of Zacks Rank signals and core fundamental measures to identify companies that may offer durable, long-term opportunities for patient investors.
This is our short term rating system that serves as a timeliness indicator for stocks over the next 1 to 3 months. How good is it? See rankings and related performance below.
The Zacks Industry Rank assigns a rating to each of the 265 X (Expanded) Industries based on their average Zacks Rank.
An industry with a larger percentage of Zacks Rank #1's and #2's will have a better average Zacks Rank than one with a larger percentage of Zacks Rank #4's and #5's.
The industry with the best average Zacks Rank would be considered the top industry (1 out of 265), which would place it in the top 1% of Zacks Ranked Industries. The industry with the worst average Zacks Rank (265 out of 265) would place in the bottom 1%.
The Zacks Sector Rank assigns a rating to each of the 16 Sectors based on their average Zacks Rank.
A sector with a larger percentage of Zacks Rank #1's and #2's will have a better average Zacks Rank than one with a larger percentage of Zacks Rank #4's and #5's.
The sector with the best average Zacks Rank would be considered the top sector (1 out of 16), which would place it in the top 1% of Zacks Ranked Sectors. The sector with the worst average Zacks Rank (16 out of 16) would place in the bottom 1%.
The Style Scores are a complementary set of indicators to use alongside the Zacks Rank. It allows the user to better focus on the stocks that are the best fit for his or her personal trading style.
The scores are based on the trading styles of Value, Growth, and Momentum. There's also a VGM Score ('V' for Value, 'G' for Growth and 'M' for Momentum), which combines the weighted average of the individual style scores into one score.
Value ScoreA
Growth ScoreA
Momentum ScoreA
VGM ScoreA
Within each Score, stocks are graded into five groups: A, B, C, D and F. As you might remember from your school days, an A, is better than a B; a B is better than a C; a C is better than a D; and a D is better than an F.
As an investor, you want to buy stocks with the highest probability of success. That means you want to buy stocks with a Zacks Rank #1 or #2, Strong Buy or Buy, which also has a Score of an A or a B in your personal trading style.
Zacks Earnings ESP (Expected Surprise Prediction) looks to find companies that have recently seen positive earnings estimate revision activity. The idea is that more recent information is, generally speaking, more accurate and can be a better predictor of the future, which can give investors an advantage in earnings season.
The technique has proven to be very useful for finding positive surprises. In fact, when combining a Zacks Rank #3 or better and a positive Earnings ESP, stocks produced a positive surprise 70% of the time, while they also saw 28.3% annual returns on average, according to our 10 year backtest.
Marathon Petroleum is a U.S. refiner and marketer with steadier midstream cash flows through its MPLX stake. In Q1 2026, results reflected a tougher margin backdrop, but management underscored disciplined capital returns supported by integrated cash generation and balance-sheet flexibility. For an EPS screen, the key is operating leverage: when cracks and utilization improve, earnings can inflect faster than revenue and drive outsized estimate revisions.
Potential Risks
Refining is volatile, so weaker product spreads, unplanned outages, or longer turnarounds can pressure profits. Renewable-fuel-credit and regulatory swings can add noise.
Forecast
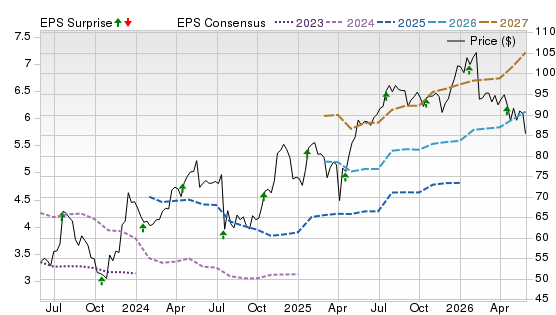
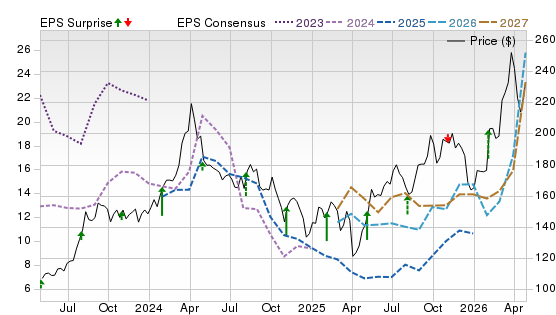
A Zacks Rank #1 (Strong Buy) with Style Scores of A for Value, B for Growth and C for Momentum signals positive revisions and supportive valuation. The Price, Consensus & EPS Surprise chart shows that the 2026-2027 consensus lines trend higher, and surprises have leaned to beats lately, leaving room for further estimate lifts.
This is our short term rating system that serves as a timeliness indicator for stocks over the next 1 to 3 months. How good is it? See rankings and related performance below.
The Zacks Industry Rank assigns a rating to each of the 265 X (Expanded) Industries based on their average Zacks Rank.
An industry with a larger percentage of Zacks Rank #1's and #2's will have a better average Zacks Rank than one with a larger percentage of Zacks Rank #4's and #5's.
The industry with the best average Zacks Rank would be considered the top industry (1 out of 265), which would place it in the top 1% of Zacks Ranked Industries. The industry with the worst average Zacks Rank (265 out of 265) would place in the bottom 1%.
The Zacks Sector Rank assigns a rating to each of the 16 Sectors based on their average Zacks Rank.
A sector with a larger percentage of Zacks Rank #1's and #2's will have a better average Zacks Rank than one with a larger percentage of Zacks Rank #4's and #5's.
The sector with the best average Zacks Rank would be considered the top sector (1 out of 16), which would place it in the top 1% of Zacks Ranked Sectors. The sector with the worst average Zacks Rank (16 out of 16) would place in the bottom 1%.
The Style Scores are a complementary set of indicators to use alongside the Zacks Rank. It allows the user to better focus on the stocks that are the best fit for his or her personal trading style.
The scores are based on the trading styles of Value, Growth, and Momentum. There's also a VGM Score ('V' for Value, 'G' for Growth and 'M' for Momentum), which combines the weighted average of the individual style scores into one score.
Value ScoreA
Growth ScoreA
Momentum ScoreA
VGM ScoreA
Within each Score, stocks are graded into five groups: A, B, C, D and F. As you might remember from your school days, an A, is better than a B; a B is better than a C; a C is better than a D; and a D is better than an F.
As an investor, you want to buy stocks with the highest probability of success. That means you want to buy stocks with a Zacks Rank #1 or #2, Strong Buy or Buy, which also has a Score of an A or a B in your personal trading style.
Zacks Earnings ESP (Expected Surprise Prediction) looks to find companies that have recently seen positive earnings estimate revision activity. The idea is that more recent information is, generally speaking, more accurate and can be a better predictor of the future, which can give investors an advantage in earnings season.
The technique has proven to be very useful for finding positive surprises. In fact, when combining a Zacks Rank #3 or better and a positive Earnings ESP, stocks produced a positive surprise 70% of the time, while they also saw 28.3% annual returns on average, according to our 10 year backtest.
Charles Schwab is a scaled brokerage, bank and advisory platform that monetizes client assets and cash. In the latest quarter, Schwab posted record net revenues and sharply higher earnings as client engagement stayed strong and core net new assets remained healthy, reinforcing operating leverage as funding costs gradually normalize. That combination can support resilient EPS even without a roaring trading tape.
Potential Risks
The biggest swing factor is net interest income: persistent “cash sorting” into higher-yield alternatives can compress spreads. Competitive pricing and market volatility could also slow asset gathering.
Forecast
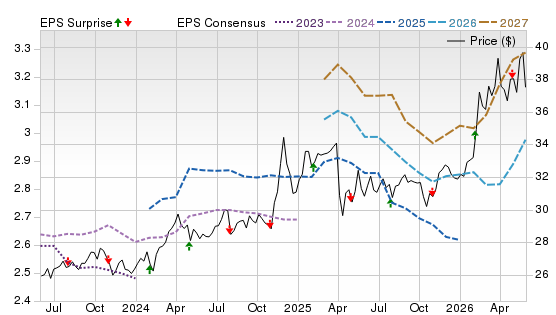
A Zacks Rank #2 (Buy) with Value B, Growth D and Momentum A suggests the stock’s forward signals are driven more by revisions and price strength than pure growth. The chart shows 2026-2027 EPS consensus still stair-stepping higher, with mixed but improving surprises, implying estimates can keep drifting up if cash trends stabilize.
This is our short term rating system that serves as a timeliness indicator for stocks over the next 1 to 3 months. How good is it? See rankings and related performance below.
The Zacks Industry Rank assigns a rating to each of the 265 X (Expanded) Industries based on their average Zacks Rank.
An industry with a larger percentage of Zacks Rank #1's and #2's will have a better average Zacks Rank than one with a larger percentage of Zacks Rank #4's and #5's.
The industry with the best average Zacks Rank would be considered the top industry (1 out of 265), which would place it in the top 1% of Zacks Ranked Industries. The industry with the worst average Zacks Rank (265 out of 265) would place in the bottom 1%.
The Zacks Sector Rank assigns a rating to each of the 16 Sectors based on their average Zacks Rank.
A sector with a larger percentage of Zacks Rank #1's and #2's will have a better average Zacks Rank than one with a larger percentage of Zacks Rank #4's and #5's.
The sector with the best average Zacks Rank would be considered the top sector (1 out of 16), which would place it in the top 1% of Zacks Ranked Sectors. The sector with the worst average Zacks Rank (16 out of 16) would place in the bottom 1%.
The Style Scores are a complementary set of indicators to use alongside the Zacks Rank. It allows the user to better focus on the stocks that are the best fit for his or her personal trading style.
The scores are based on the trading styles of Value, Growth, and Momentum. There's also a VGM Score ('V' for Value, 'G' for Growth and 'M' for Momentum), which combines the weighted average of the individual style scores into one score.
Value ScoreA
Growth ScoreA
Momentum ScoreA
VGM ScoreA
Within each Score, stocks are graded into five groups: A, B, C, D and F. As you might remember from your school days, an A, is better than a B; a B is better than a C; a C is better than a D; and a D is better than an F.
As an investor, you want to buy stocks with the highest probability of success. That means you want to buy stocks with a Zacks Rank #1 or #2, Strong Buy or Buy, which also has a Score of an A or a B in your personal trading style.
Zacks Earnings ESP (Expected Surprise Prediction) looks to find companies that have recently seen positive earnings estimate revision activity. The idea is that more recent information is, generally speaking, more accurate and can be a better predictor of the future, which can give investors an advantage in earnings season.
The technique has proven to be very useful for finding positive surprises. In fact, when combining a Zacks Rank #3 or better and a positive Earnings ESP, stocks produced a positive surprise 70% of the time, while they also saw 28.3% annual returns on average, according to our 10 year backtest.
Enterprise Products Partners runs fee-based pipelines, processing and export assets across NGLs, crude, natural gas and petrochemicals. In Q1 2026, results highlighted durable cash generation and continued demand for Gulf Coast export infrastructure, supporting steady distributable cash flow and a smooth EPS profile. Its scale and integrated system can keep volumes sticky even when producers pull back.
Potential Risks
Volumes and certain margin-sensitive activities can weaken if U.S. production slows or global petrochemical demand softens, and new Gulf Coast capacity can intensify competition for barrels. Regulatory, permitting, or project-cost surprises can also extend paybacks.
Forecast
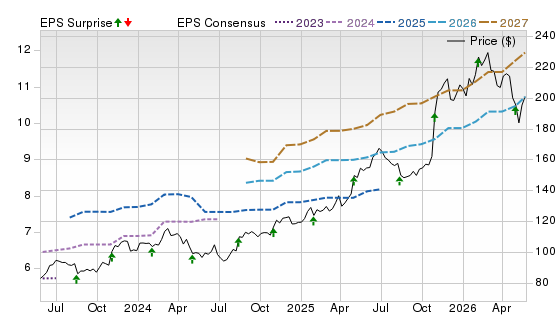
A Zacks Rank #2 with B for Value and Momentum and D for Growth points to a stable, revision-supported setup rather than a high-growth story. The chart shows 2026-2027 consensus edging flatter to slightly lower, and surprises are mostly modest, suggesting expectations are conservative, helpful if export-driven volumes outperform.
This is our short term rating system that serves as a timeliness indicator for stocks over the next 1 to 3 months. How good is it? See rankings and related performance below.
The Zacks Industry Rank assigns a rating to each of the 265 X (Expanded) Industries based on their average Zacks Rank.
An industry with a larger percentage of Zacks Rank #1's and #2's will have a better average Zacks Rank than one with a larger percentage of Zacks Rank #4's and #5's.
The industry with the best average Zacks Rank would be considered the top industry (1 out of 265), which would place it in the top 1% of Zacks Ranked Industries. The industry with the worst average Zacks Rank (265 out of 265) would place in the bottom 1%.
The Zacks Sector Rank assigns a rating to each of the 16 Sectors based on their average Zacks Rank.
A sector with a larger percentage of Zacks Rank #1's and #2's will have a better average Zacks Rank than one with a larger percentage of Zacks Rank #4's and #5's.
The sector with the best average Zacks Rank would be considered the top sector (1 out of 16), which would place it in the top 1% of Zacks Ranked Sectors. The sector with the worst average Zacks Rank (16 out of 16) would place in the bottom 1%.
The Style Scores are a complementary set of indicators to use alongside the Zacks Rank. It allows the user to better focus on the stocks that are the best fit for his or her personal trading style.
The scores are based on the trading styles of Value, Growth, and Momentum. There's also a VGM Score ('V' for Value, 'G' for Growth and 'M' for Momentum), which combines the weighted average of the individual style scores into one score.
Value ScoreA
Growth ScoreA
Momentum ScoreA
VGM ScoreA
Within each Score, stocks are graded into five groups: A, B, C, D and F. As you might remember from your school days, an A, is better than a B; a B is better than a C; a C is better than a D; and a D is better than an F.
As an investor, you want to buy stocks with the highest probability of success. That means you want to buy stocks with a Zacks Rank #1 or #2, Strong Buy or Buy, which also has a Score of an A or a B in your personal trading style.
Zacks Earnings ESP (Expected Surprise Prediction) looks to find companies that have recently seen positive earnings estimate revision activity. The idea is that more recent information is, generally speaking, more accurate and can be a better predictor of the future, which can give investors an advantage in earnings season.
The technique has proven to be very useful for finding positive surprises. In fact, when combining a Zacks Rank #3 or better and a positive Earnings ESP, stocks produced a positive surprise 70% of the time, while they also saw 28.3% annual returns on average, according to our 10 year backtest.
Cardinal Health distributes pharmaceuticals and provides medical products and higher-value specialty services. In fiscal Q3 2026, the company delivered a sizable adjusted EPS beat and raised-and-narrowed full-year adjusted EPS guidance, reflecting strong performance in Pharmaceutical and Specialty Solutions despite a hit from an impairment charge. That consistent “beat-and-raise” cadence is what keeps the EPS narrative compelling.
Potential Risks
Drug distribution is structurally low margin and sensitive to customer contract dynamics, reimbursement pressure, and working-capital swings. Integration or execution missteps in specialty and services, or heightened regulatory scrutiny, could also weigh on multiples.
Forecast
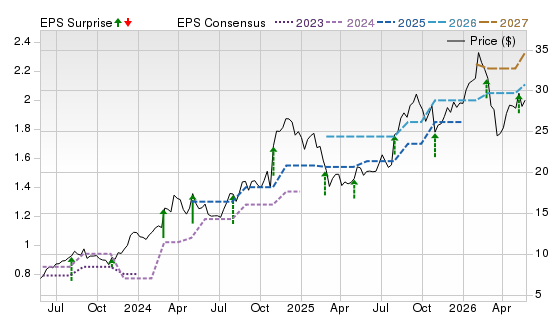
A Zacks Rank #2 with A for Value and Growth and C for Momentum signals an attractively valued earnings trend, even if near-term price momentum is softer. The chart shows 2026-2027 consensus stepping higher with a run of recent beats, supporting incremental upward revisions if specialty strength persists.
This is our short term rating system that serves as a timeliness indicator for stocks over the next 1 to 3 months. How good is it? See rankings and related performance below.
The Zacks Industry Rank assigns a rating to each of the 265 X (Expanded) Industries based on their average Zacks Rank.
An industry with a larger percentage of Zacks Rank #1's and #2's will have a better average Zacks Rank than one with a larger percentage of Zacks Rank #4's and #5's.
The industry with the best average Zacks Rank would be considered the top industry (1 out of 265), which would place it in the top 1% of Zacks Ranked Industries. The industry with the worst average Zacks Rank (265 out of 265) would place in the bottom 1%.
The Zacks Sector Rank assigns a rating to each of the 16 Sectors based on their average Zacks Rank.
A sector with a larger percentage of Zacks Rank #1's and #2's will have a better average Zacks Rank than one with a larger percentage of Zacks Rank #4's and #5's.
The sector with the best average Zacks Rank would be considered the top sector (1 out of 16), which would place it in the top 1% of Zacks Ranked Sectors. The sector with the worst average Zacks Rank (16 out of 16) would place in the bottom 1%.
The Style Scores are a complementary set of indicators to use alongside the Zacks Rank. It allows the user to better focus on the stocks that are the best fit for his or her personal trading style.
The scores are based on the trading styles of Value, Growth, and Momentum. There's also a VGM Score ('V' for Value, 'G' for Growth and 'M' for Momentum), which combines the weighted average of the individual style scores into one score.
Value ScoreA
Growth ScoreA
Momentum ScoreA
VGM ScoreA
Within each Score, stocks are graded into five groups: A, B, C, D and F. As you might remember from your school days, an A, is better than a B; a B is better than a C; a C is better than a D; and a D is better than an F.
As an investor, you want to buy stocks with the highest probability of success. That means you want to buy stocks with a Zacks Rank #1 or #2, Strong Buy or Buy, which also has a Score of an A or a B in your personal trading style.
Zacks Earnings ESP (Expected Surprise Prediction) looks to find companies that have recently seen positive earnings estimate revision activity. The idea is that more recent information is, generally speaking, more accurate and can be a better predictor of the future, which can give investors an advantage in earnings season.
The technique has proven to be very useful for finding positive surprises. In fact, when combining a Zacks Rank #3 or better and a positive Earnings ESP, stocks produced a positive surprise 70% of the time, while they also saw 28.3% annual returns on average, according to our 10 year backtest.
Interface makes modular carpet tile and resilient flooring for commercial interiors, differentiated by design and sustainability. In the latest quarter, Interface grew sales and delivered a clear adjusted EPS beat, then raised full-year guidance as its “One Interface” initiatives improved mix and execution. For EPS, the setup is straightforward: a modest recovery in commercial demand can drive outsized profit leverage after recent restructuring and productivity gains.
Potential Risks
Commercial renovation is cyclical, so a slowdown in office, education, or hospitality spending can pressure volumes and pricing. Input cost inflation or freight disruptions can squeeze gross margin.
Forecast
A Zacks Rank #2 with Value A, Growth B and Momentum C points to a reasonably priced earnings recovery. The chart shows 2026-2027 estimates trending upward and recent surprises skewing positive, suggesting analysts may keep nudging forecasts higher if demand holds.
The Zacks Rank is a proprietary stock-rating model that uses trends in earnings estimate revisions and earnings-per-share (EPS) surprises to classify stocks into five groups: #1 (Strong Buy), #2 (Buy), #3 (Hold), #4 (Sell) and #5 (Strong Sell). The Zacks Rank is calculated through four primary factors related to earnings estimates: analysts' consensus on earnings estimate revisions, the magnitude of revision change, the upside potential and estimate surprise (or the degree in which earnings per share deviated from the previous quarter).
Zacks builds the data from 3,000 analysts at over 150 different brokerage firms. The average yearly gain for Zacks Rank #1 (Strong Buy) stocks is +23.62% per year from January, 1988, through June 2, 2025.
Selections for Best EPS Stocks are based on historical performance for earnings per share, as well as forecasted EPS performance, along with the current top ranking stocks based on Zacks Indicator Score, Style Scores and fundamentals. All stocks have a daily trading volume of at least 100,000 shares and have a stock price of at least $5. All information is current as of market open, May 29, 2026.
Guide to Best EPS Stocks
What does EPS mean in stocks?
EPS (earnings per share) measures a company’s net income divided by its total outstanding shares. It shows how much profit is attributed to each share of stock.
EPS is a core indicator of profitability and is often used by analysts to compare companies within the same sector.
Why invest in high EPS stocks
Strong EPS often signals efficient management and profitability.
Companies with rising EPS tend to attract institutional investors.
High earnings can support stock price appreciation over time.
What is considered a high EPS?
A high EPS depends on context, but generally:
Large-cap companies with double-digit EPS growth are attractive.
Stocks with consistently rising EPS over multiple quarters stand out.
A high EPS relative to competitors is often more meaningful than the raw number.
Pros of investing in high EPS stocks
Strong profitability: High EPS reflects solid earnings performance.
Potential for capital gains: Earnings growth often drives stock prices higher.
Dividend potential: Profitable companies may return cash to shareholders.
Market confidence: High EPS companies often attract institutional support.
Cons of investing in high EPS stocks
Overvaluation risk: High EPS stocks can trade at premium prices.
Earnings volatility: EPS can fluctuate due to economic cycles.
Accounting distortions: One-time gains can inflate EPS.
Sector bias: Some industries naturally have higher EPS than others.
How to choose the high EPS Stocks
When screening for top EPS stocks, consider:
Consistent earnings growth over multiple quarters or years.
Many investors also look for companies included in major growth lists or earnings gainers with strong forward guidance.
How to invest in high EPS stocks
To invest effectively:
Use stock screeners to identify companies with top EPS and growth rates.
Compare companies within the same industry.
Evaluate valuation metrics like P/E ratio.
Diversify across sectors to reduce risk.
Monitor quarterly earnings reports for changes.
What other metrics should I consider besides EPS?
EPS should never be used in isolation. Combine it with:
P/E ratio (valuation relative to earnings).
Revenue growth.
Return on equity (ROE).
Free cash flow.
Debt-to-equity ratio.
These metrics provide a fuller picture of financial health.
Tips for Building a High EPS Portfolio
Focus on quality over quantity—strong, consistent earners.
Blend growth stocks and stable blue chips.
Avoid chasing stocks with sudden EPS spikes.
Rebalance regularly based on earnings performance.
Keep a long-term perspective rather than reacting to short-term fluctuations.
Frequently Asked Questions About EPS Stocks
What is an EPS Trap?
An EPS trap occurs when a stock appears attractive due to high earnings, but the growth is unsustainable. This can happen due to:
One-time gains (asset sales, tax benefits)
Cost-cutting rather than real growth
Declining revenue masked by accounting adjustments
Can EPS be manipulated or misleading?
Yes. EPS can be influenced by:
Share buybacks (reducing share count boosts EPS)
Accounting adjustments
Non-recurring income
That’s why investors should always look at adjusted EPS and underlying fundamentals.
Do high EPS stocks pay better dividends?
Not always, but often:
Companies with strong earnings are more capable of paying dividends.
Some high-growth companies reinvest earnings instead of paying dividends.
Dividend yield depends on company strategy, not just EPS.
What’s the difference between the EPS and PE ratio?
EPS measures profitability per share
P/E ratio measures how much investors are willing to pay for that earnings
In simple terms:
EPS = earnings strength
P/E = valuation of those earnings
Both are essential for identifying the best EPS stocks to buy.
Bottom line: High EPS stocks can be powerful additions to a portfolio—but the best opportunities come from companies with consistent earnings growth, reasonable valuations, and strong fundamentals, not just the highest headline numbers.




 View the Zacks #1 Rank List


 Strong Buy