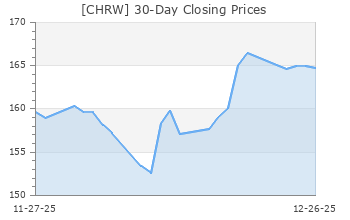
C.H. Robinson Worldwide (CHRW)
(Delayed Data from NSDQ)
$70.22 USD
-0.04 (-0.06%)
Updated Apr 26, 2024 04:00 PM ET
After-Market: $70.22 0.00 (0.00%) 7:58 PM ET
4-Sell of 5 4
C Value A Growth C Momentum B VGM
Company Summary
Based in Minnesota, C.H. Robinson Worldwide Inc. is a third-party logistics company. As a asset-light transportation provider, C.H. Robinson provides freight transportation services and logistic solutions to companies across a range of industries. The company's services range from commitments on a specific shipment to more comprehensive and integrated relationships.
During 2023, the company was responsible for handling approximately 19 million shipments and served more than 90,000 customers. C.H. Robinson operates through a network of offices in North America, Europe, Asia, Oceania, and South America.
In 2023, the company utilized more than 450,000 contracted ...
Company Summary
Based in Minnesota, C.H. Robinson Worldwide Inc. is a third-party logistics company. As a asset-light transportation provider, C.H. Robinson provides freight transportation services and logistic solutions to companies across a range of industries. The company's services range from commitments on a specific shipment to more comprehensive and integrated relationships.
During 2023, the company was responsible for handling approximately 19 million shipments and served more than 90,000 customers. C.H. Robinson operates through a network of offices in North America, Europe, Asia, Oceania, and South America.
In 2023, the company utilized more than 450,000 contracted transportation companies, including motor carriers, railroads (mainly intermodal service providers), apart from air and ocean carriers. On the basis of the needs of its customers and their supply chain requirements, the company selects the mode of transportation for a shipment.
The company's major divisions are as follows:
NAST (North American Surface Transportation) offers freight transportation services across North America through a network of offices in the United States, Canada, and Mexico. In March 2020, C.H. Robinson acquired Prime Distribution Services. Previously, in 2019, the company purchased Dema Service. Notably, Robinson Fresh offers sourcing services including the buying, selling, and marketing of fresh fruits, vegetables, and other perishable items.
The Global Forwarding unit is responsible for providing global logistics services through an international network of offices in North America, Asia, Europe, Australia, and South America. It also contracts with independent agents worldwide. In a bid to strengthen its Global Forwarding business, C.H. Robinson acquired The Space Cargo Group in March 2019.
In 2023, the NAST and Global Forwarding units contributed 70.8% and 17% respectively to total revenues of $17.59 billion. The All Other and Corporate unit, which consists of the company's non-reportable segments, like Managed Services, generated the remaining portion or 12% of total revenues.
The company's fiscal year coincides with the calendar year.
General Information
CH Robinson Worldwide, Inc
14701 CHARLSON ROAD
EDEN PRAIRIE, MN 55347
Phone: 952-937-8500
Fax: 952-937-6714
Web: http://www.chrobinson.com
Email: chuck.ives@chrobinson.com
| Industry | Transportation - Services |
| Sector | Transportation |
| Fiscal Year End | December |
| Last Reported Quarter | 3/31/2024 |
| Earnings Date | 5/1/2024 |
EPS Information
| Current Quarter EPS Consensus Estimate | 0.60 |
| Current Year EPS Consensus Estimate | 3.24 |
| Estimated Long-Term EPS Growth Rate | 6.00 |
| Earnings Date | 5/1/2024 |
Price and Volume Information
| Zacks Rank | |
| Yesterday's Close | 70.26 |
| 52 Week High | 106.14 |
| 52 Week Low | 65.00 |
| Beta | 0.72 |
| 20 Day Moving Average | 1,200,115.88 |
| Target Price Consensus | 79.00 |

| 4 Week | -7.78 |
| 12 Week | -4.46 |
| YTD | -18.72 |
| 4 Week | -4.98 |
| 12 Week | -8.09 |
| YTD | -23.16 |
| Shares Outstanding (millions) | 116.99 |
| Market Capitalization (millions) | 8,215.32 |
| Short Ratio | NA |
| Last Split Date | 10/17/2005 |
| Dividend Yield | 3.47% |
| Annual Dividend | $2.44 |
| Payout Ratio | 0.76 |
| Change in Payout Ratio | 0.30 |
| Last Dividend Payout / Amount | 2/29/2024 / $0.61 |
Fundamental Ratios
| P/E (F1) | 21.65 |
| Trailing 12 Months | 21.81 |
| PEG Ratio | 3.61 |
| vs. Previous Year | -51.46% |
| vs. Previous Quarter | -40.48% |
| vs. Previous Year | -16.68% |
| vs. Previous Quarter | -2.74% |
| Price/Book | 5.77 |
| Price/Cash Flow | 16.58 |
| Price / Sales | 0.47 |
| 3/31/24 | NA |
| 12/31/23 | 27.61 |
| 9/30/23 | 32.74 |
| 3/31/24 | NA |
| 12/31/23 | 7.17 |
| 9/30/23 | 8.12 |
| 3/31/24 | NA |
| 12/31/23 | 1.40 |
| 9/30/23 | 1.12 |
| 3/31/24 | NA |
| 12/31/23 | 1.40 |
| 9/30/23 | 1.12 |
| 3/31/24 | NA |
| 12/31/23 | 2.19 |
| 9/30/23 | 2.45 |
| 3/31/24 | NA |
| 12/31/23 | 1.85 |
| 9/30/23 | 2.13 |
| 3/31/24 | NA |
| 12/31/23 | 2.33 |
| 9/30/23 | 2.50 |
| 3/31/24 | NA |
| 12/31/23 | 12.16 |
| 9/30/23 | 12.06 |
| 3/31/24 | NA |
| 12/31/23 | NA |
| 9/30/23 | NA |
| 3/31/24 | NA |
| 12/31/23 | 1.00 |
| 9/30/23 | 0.66 |
| 3/31/24 | NA |
| 12/31/23 | 50.03 |
| 9/30/23 | 39.60 |

