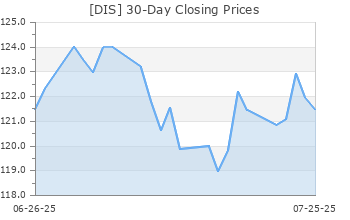
Disney (DIS)
(Delayed Data from NYSE)
$112.73 USD
-0.04 (-0.04%)
Updated Apr 26, 2024 04:02 PM ET
After-Market: $112.54 -0.19 (-0.17%) 7:58 PM ET
2-Buy of 5 2
C Value C Growth B Momentum C VGM
Company Summary
Burbank, CA-based Walt Disney Company has assets that span movies, television shows and theme parks. Revenues were $88.89 billion in fiscal 2023.
In October 2020, Disney reorganized its media and entertainment operations, which were previously reported in three segments: Media Networks, Studio Entertainment and Direct-to-Consumer & International.
From the first quarter of fiscal 2021, Disney began reporting the financial results of the media and entertainment businesses as one segment, Disney Media and Entertainment Distribution (DMED), across three significant lines of businesses: Linear Networks, Direct-to-Consumer and Content Sales/Licensing.
DMED (63.4% of total revenues) segment includes ...
Company Summary
Burbank, CA-based Walt Disney Company has assets that span movies, television shows and theme parks. Revenues were $88.89 billion in fiscal 2023.
In October 2020, Disney reorganized its media and entertainment operations, which were previously reported in three segments: Media Networks, Studio Entertainment and Direct-to-Consumer & International.
From the first quarter of fiscal 2021, Disney began reporting the financial results of the media and entertainment businesses as one segment, Disney Media and Entertainment Distribution (DMED), across three significant lines of businesses: Linear Networks, Direct-to-Consumer and Content Sales/Licensing.
DMED (63.4% of total revenues) segment includes Domestic Channels, International Channels, a 50% equity investment in A+E Television Networks (A+E), Disney+, Disney+ Hotstar, ESPN+, Hulu and Star+ DTC streaming services, Sales/licensing of film and television content to third-party television and subscription video-on-demand (TV/SVOD) services, Theatrical and Music distribution, Home entertainment distribution and Staging and licensing of live entertainment events on Broadway and around the world.
Parks, Experiences & Consumer Products (36.6% of revenues) segment combines global consumer products business with Parks and Resorts. Parks and Resorts segment owns and operates the Disney World Resort in Florida, the Disneyland Resort in California, the Disney Vacation Club, the Disney Cruise Line, and Adventures by Disney. The company also has ownership interests in Disneyland Paris, Hong Kong Disneyland Resort and Shanghai Disney Resort, and licenses the operations of the Tokyo Disney Resort in Japan.
Consumer products business engages with licensees, manufacturers, publishers and retailers to design, develop, publish, promote and sell a wide variety of products based on existing and new Disney characters and other intellectual property via its Merchandise Licensing, Publishing and Retail businesses throughout the world.
General Information
The Walt Disney Company
500 SOUTH BUENA VISTA ST
BURBANK, CA 91521
Phone: 818-560-1000
Fax: 818-560-1930
Web: http://www.thewaltdisneycompany.com
Email: NA
| Industry | Media Conglomerates |
| Sector | Consumer Discretionary |
| Fiscal Year End | September |
| Last Reported Quarter | 3/31/2024 |
| Earnings Date | 5/7/2024 |
EPS Information
| Current Quarter EPS Consensus Estimate | 1.09 |
| Current Year EPS Consensus Estimate | 4.66 |
| Estimated Long-Term EPS Growth Rate | 17.50 |
| Earnings Date | 5/7/2024 |
Price and Volume Information
| Zacks Rank | |
| Yesterday's Close | 112.77 |
| 52 Week High | 123.74 |
| 52 Week Low | 79.06 |
| Beta | 1.42 |
| 20 Day Moving Average | 9,049,604.00 |
| Target Price Consensus | 125.65 |

| 4 Week | -7.84 |
| 12 Week | 16.19 |
| YTD | 24.90 |
| 4 Week | -4.08 |
| 12 Week | 12.91 |
| YTD | 18.00 |
| Shares Outstanding (millions) | 1,834.33 |
| Market Capitalization (millions) | 206,857.27 |
| Short Ratio | NA |
| Last Split Date | 7/10/1998 |
| Dividend Yield | 0.27% |
| Annual Dividend | $0.30 |
| Payout Ratio | 0.08 |
| Change in Payout Ratio | -0.01 |
| Last Dividend Payout / Amount | NA / $0.00 |
Fundamental Ratios
| P/E (F1) | 24.20 |
| Trailing 12 Months | 28.19 |
| PEG Ratio | 1.39 |
| vs. Previous Year | 23.23% |
| vs. Previous Quarter | 48.78% |
| vs. Previous Year | 0.16% |
| vs. Previous Quarter | 10.87% |
| Price/Book | 1.96 |
| Price/Cash Flow | 16.34 |
| Price / Sales | 2.33 |
| 3/31/24 | NA |
| 12/31/23 | 7.88 |
| 9/30/23 | 7.31 |
| 3/31/24 | NA |
| 12/31/23 | 4.01 |
| 9/30/23 | 3.65 |
| 3/31/24 | NA |
| 12/31/23 | 0.84 |
| 9/30/23 | 1.05 |
| 3/31/24 | NA |
| 12/31/23 | 0.77 |
| 9/30/23 | 0.99 |
| 3/31/24 | NA |
| 12/31/23 | 9.14 |
| 9/30/23 | 8.38 |
| 3/31/24 | NA |
| 12/31/23 | 3.36 |
| 9/30/23 | 2.65 |
| 3/31/24 | NA |
| 12/31/23 | 6.60 |
| 9/30/23 | 5.36 |
| 3/31/24 | NA |
| 12/31/23 | 57.52 |
| 9/30/23 | 58.37 |
| 3/31/24 | NA |
| 12/31/23 | 30.48 |
| 9/30/23 | 31.40 |
| 3/31/24 | NA |
| 12/31/23 | 0.39 |
| 9/30/23 | 0.40 |
| 3/31/24 | NA |
| 12/31/23 | 28.28 |
| 9/30/23 | 32.98 |

