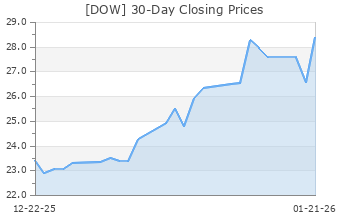
Dow (DOW)
(Delayed Data from NYSE)
$57.29 USD
+0.85 (1.51%)
Updated Apr 26, 2024 04:00 PM ET
After-Market: $57.30 +0.01 (0.02%) 7:58 PM ET
3-Hold of 5 3
B Value C Growth A Momentum A VGM
Company Summary
Dow Inc. is a material science company, providing a world-class portfolio of advanced, sustainable and leading-edge products. It came into being since its separation from DowDuPont Inc. in 2019. Shares of Dow started trading on the NYSE on Apr 2, 2019.
Dow recorded revenues of around $44.6 billion in 2023. It offers a vast range of differentiated products and solutions across high-growth market segments such as packaging, infrastructure and consumer care. Its ethylene plant in Freeport, TX, having a total capacity of 2,000 kilotons per year, is the largest ethylene cracker on the planet.
...
Company Summary
Dow Inc. is a material science company, providing a world-class portfolio of advanced, sustainable and leading-edge products. It came into being since its separation from DowDuPont Inc. in 2019. Shares of Dow started trading on the NYSE on Apr 2, 2019.
Dow recorded revenues of around $44.6 billion in 2023. It offers a vast range of differentiated products and solutions across high-growth market segments such as packaging, infrastructure and consumer care. Its ethylene plant in Freeport, TX, having a total capacity of 2,000 kilotons per year, is the largest ethylene cracker on the planet.
Dow’s broad portfolio of higher-value functional polymers, significant low-cost global feedstock positions, global footprint and market reach and manufacturing sites in every geographic region places it in an advantageous position against competitors. The company currently operates in three segments:
Packaging & Specialty Plastics: The segment employs the industry’s broadest polyolefin product portfolio. The unit leverages Dow’s proprietary catalyst and manufacturing process technologies to deliver higher performing and sustainable plastics to customers across end markets, including food and specialty packaging, industrial and consumer packaging. The segment accounted for 52% of 2023 sales.
Performance Materials & Coatings: The unit provides a vast range of solutions to consumer and infrastructure end-markets. It comprises coatings & performance monomers and consumer solutions businesses. These businesses employ materials science capabilities, unique products and technology, and global reach to offer differentiated products to customers. The unit accounted for 19% of 2023 sales.
Industrial Intermediates & Infrastructure: The segment comprises industrial solutions, and polyurethanes & construction chemicals businesses. These businesses develop key intermediate chemicals for production processes as well as downstream, customized materials and formulations that utilize advanced development technologies. The segment accounted for 28% of 2023 sales.
General Information
Dow Inc
2211 H.H. DOW WAY
MIDLAND, MI 48674
Phone: 989-636-1000
Fax: 989-832-1456
Web: http://www.dow.com
Email: ir@dow.com
| Industry | Chemical - Diversified |
| Sector | Basic Materials |
| Fiscal Year End | December |
| Last Reported Quarter | 3/31/2024 |
| Exp Earnings Date | 7/23/2024 |
EPS Information
| Current Quarter EPS Consensus Estimate | 0.82 |
| Current Year EPS Consensus Estimate | 3.12 |
| Estimated Long-Term EPS Growth Rate | 23.40 |
| Exp Earnings Date | 7/23/2024 |
Price and Volume Information
| Zacks Rank | |
| Yesterday's Close | 56.44 |
| 52 Week High | 60.69 |
| 52 Week Low | 47.26 |
| Beta | 1.31 |
| 20 Day Moving Average | 3,951,682.50 |
| Target Price Consensus | 58.38 |

| 4 Week | -2.57 |
| 12 Week | 5.42 |
| YTD | 2.92 |
| 4 Week | 1.40 |
| 12 Week | 2.45 |
| YTD | -2.76 |
| Shares Outstanding (millions) | 702.29 |
| Market Capitalization (millions) | 39,637.44 |
| Short Ratio | NA |
| Last Split Date | NA |
| Dividend Yield | 4.96% |
| Annual Dividend | $2.80 |
| Payout Ratio | 1.25 |
| Change in Payout Ratio | 0.39 |
| Last Dividend Payout / Amount | 2/28/2024 / $0.70 |
Fundamental Ratios
| P/E (F1) | 18.06 |
| Trailing 12 Months | 25.42 |
| PEG Ratio | 0.77 |
| vs. Previous Year | -6.52% |
| vs. Previous Quarter | -10.42% |
| vs. Previous Year | -10.44% |
| vs. Previous Quarter | -1.02% |
| Price/Book | 2.10 |
| Price/Cash Flow | 9.39 |
| Price / Sales | 0.91 |
| 3/31/24 | NA |
| 12/31/23 | 7.97 |
| 9/30/23 | 7.90 |
| 3/31/24 | NA |
| 12/31/23 | 2.74 |
| 9/30/23 | 2.76 |
| 3/31/24 | NA |
| 12/31/23 | 1.77 |
| 9/30/23 | 1.79 |
| 3/31/24 | NA |
| 12/31/23 | 1.16 |
| 9/30/23 | 1.18 |
| 3/31/24 | NA |
| 12/31/23 | 3.59 |
| 9/30/23 | 3.55 |
| 3/31/24 | NA |
| 12/31/23 | 1.32 |
| 9/30/23 | 2.85 |
| 3/31/24 | NA |
| 12/31/23 | 1.47 |
| 9/30/23 | 4.08 |
| 3/31/24 | NA |
| 12/31/23 | 27.24 |
| 9/30/23 | 28.63 |
| 3/31/24 | NA |
| 12/31/23 | 6.21 |
| 9/30/23 | 6.15 |
| 3/31/24 | NA |
| 12/31/23 | 0.78 |
| 9/30/23 | 0.73 |
| 3/31/24 | NA |
| 12/31/23 | 43.83 |
| 9/30/23 | 42.09 |

