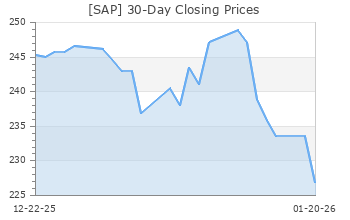
SAP (SAP)
(Delayed Data from NYSE)
$186.18 USD
+1.09 (0.59%)
Updated Apr 26, 2024 04:00 PM ET
After-Market: $186.18 0.00 (0.00%) 7:58 PM ET
5-Strong Sell of 5 5
D Value B Growth F Momentum C VGM
Company Summary
Headquartered in Walldorf, Germany, SAP SE is one of the largest independent software vendors in the world and the leading provider of enterprise resource planning (ERP) software.
Its solutions (enterprise applications software, enterprise resource management applications, supply chain management applications, procurement applications software, travel and expense management software, and enterprise resource planning software among others) are designed to cater to the needs of organizations, ranging from small and medium businesses to large, global enterprises.
The strategic pillars of SAP’s product strategy include ERP Cloud (SAP S/4HANA), ...
Company Summary
Headquartered in Walldorf, Germany, SAP SE is one of the largest independent software vendors in the world and the leading provider of enterprise resource planning (ERP) software.
Its solutions (enterprise applications software, enterprise resource management applications, supply chain management applications, procurement applications software, travel and expense management software, and enterprise resource planning software among others) are designed to cater to the needs of organizations, ranging from small and medium businesses to large, global enterprises.
The strategic pillars of SAP’s product strategy include ERP Cloud (SAP S/4HANA), Human Experience Management (SAP SuccessFactors), Spend Management (intelligent spend management solutions), The SAP Customer Experience portfolio, SAP Business Technology Platform, Industry Cloud, SAP Business Network, SAP Signavio, Experience Management and Sustainability solutions and services.
SAP also boasts an extensive partner ecosystem with more than 20,000 partners worldwide in more than 140 countries.
SAP reported revenues of €31.207 billion in 2023. Total revenues, on a non-IFRS basis, also came in at €31.207 billion. The company reports revenues under two broad segments: Cloud and Software and Services.
Cloud and Software (86.3% of total 2023 revenues): This segment comprises revenues from fast-growing cloud business. Revenues from cloud is derived from fees earned from providing customers with Software as a service (SaaS), Platform as a service (PaaS) and Infrastructure as a service (IaaS). SaaS comprises all offerings which are not included in PaaS and IaaS. PaaS includes SAP Business Technology Platform and SAP Signavio. IaaS includes revenues from SAP HANA Enterprise Cloud.
Services (13.7%): Services revenues primarily comprise consulting and other service revenues.
General Information
SAP SE
DIETMAR-HOPP-ALLEE 16
WALLDORF, 2M 69190
Phone: 49-62-2774-7474
Fax: 49-62-2775-7575
Web: http://www.sap.com
Email: investor@sap.com
| Industry | Computer - Software |
| Sector | Computer and Technology |
| Fiscal Year End | December |
| Last Reported Quarter | 3/31/2024 |
| Exp Earnings Date | 7/18/2024 |
EPS Information
| Current Quarter EPS Consensus Estimate | 1.03 |
| Current Year EPS Consensus Estimate | 4.58 |
| Estimated Long-Term EPS Growth Rate | 11.10 |
| Exp Earnings Date | 7/18/2024 |
Price and Volume Information
| Zacks Rank | |
| Yesterday's Close | 185.09 |
| 52 Week High | 199.29 |
| 52 Week Low | 126.75 |
| Beta | 1.25 |
| 20 Day Moving Average | 895,693.31 |
| Target Price Consensus | 206.00 |

| 4 Week | -4.54 |
| 12 Week | 5.15 |
| YTD | 20.43 |
| 4 Week | -1.65 |
| 12 Week | 2.24 |
| YTD | 13.12 |
| Shares Outstanding (millions) | NA |
| Market Capitalization (millions) | NA |
| Short Ratio | NA |
| Last Split Date | 7/28/1998 |
| Dividend Yield | 0.87% |
| Annual Dividend | $1.61 |
| Payout Ratio | 0.41 |
| Change in Payout Ratio | 0.02 |
| Last Dividend Payout / Amount | NA / $0.00 |
Fundamental Ratios
| P/E (F1) | 40.65 |
| Trailing 12 Months | 36.36 |
| PEG Ratio | 3.65 |
| vs. Previous Year | 15.79% |
| vs. Previous Quarter | -21.43% |
| vs. Previous Year | 9.37% |
| vs. Previous Quarter | -4.25% |
| Price/Book | 4.67 |
| Price/Cash Flow | 25.97 |
| Price / Sales | NA |
| 3/31/24 | 9.79 |
| 12/31/23 | 9.54 |
| 9/30/23 | 8.22 |
| 3/31/24 | 6.05 |
| 12/31/23 | 5.86 |
| 9/30/23 | 4.97 |
| 3/31/24 | 1.25 |
| 12/31/23 | 1.40 |
| 9/30/23 | 1.55 |
| 3/31/24 | NA |
| 12/31/23 | 1.40 |
| 9/30/23 | 1.55 |
| 3/31/24 | 13.30 |
| 12/31/23 | 13.17 |
| 9/30/23 | 11.41 |
| 3/31/24 | 15.76 |
| 12/31/23 | 20.30 |
| 9/30/23 | 18.45 |
| 3/31/24 | 11.58 |
| 12/31/23 | 17.11 |
| 9/30/23 | 13.86 |
| 3/31/24 | NA |
| 12/31/23 | 39.83 |
| 9/30/23 | 39.90 |
| 3/31/24 | NA |
| 12/31/23 | NA |
| 9/30/23 | NA |
| 3/31/24 | 0.18 |
| 12/31/23 | 0.18 |
| 9/30/23 | 0.21 |
| 3/31/24 | 15.48 |
| 12/31/23 | 15.47 |
| 9/30/23 | 17.59 |

