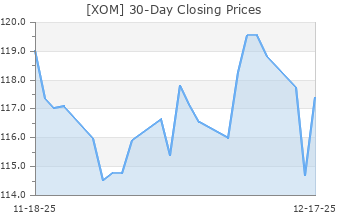
Exxon Mobil (XOM)
(Delayed Data from NYSE)
$117.96 USD
-3.37 (-2.78%)
Updated Apr 26, 2024 04:02 PM ET
After-Market: $118.04 +0.08 (0.07%) 7:58 PM ET
3-Hold of 5 3
B Value B Growth A Momentum A VGM
Company Summary
ExxonMobil's bellwether status in the energy space, optimal integrated capital structure that has historically produced industry-leading returns and management's track record of capex discipline across the commodity price cycle make it a relatively lower-risk energy sector play.
The company's upstream portfolio has not generated much production growth in 2019 and the trend isn't expected to change at least in the near term. It nevertheless owns some of the most prolific upstream assets globally. Other aspects of ...
Company Summary
ExxonMobil's bellwether status in the energy space, optimal integrated capital structure that has historically produced industry-leading returns and management's track record of capex discipline across the commodity price cycle make it a relatively lower-risk energy sector play.
The company's upstream portfolio has not generated much production growth in 2019 and the trend isn't expected to change at least in the near term. It nevertheless owns some of the most prolific upstream assets globally. Other aspects of the company's story include the largest global refining operations, substantial chemicals assets and a dividend history and credit profile that are second to none in the space.
As compared to other energy giants, ExxonMobil's capital spending discipline is quite aggressive. The company has a plan in place to allocate significant proportion of its budget to key oil and gas projects that include offshore Guyana resources and Permian - the most prolific shale play in the United States.
Needless to say, the company's business perspective looks different from most peers since big oil rivals have pledged to lower carbon emissions to tackle climate change.
ExxonMobil organizes its operations into four primary business segments: Upstream, Energy Products, Chemical Products, and Specialty Products. The Upstream segment encompasses the company's activities related to the exploration and production of crude oil and natural gas. Meanwhile, the Energy Products, Chemical Products, and Specialty Products segments encompass the manufacturing and sales of petroleum products and petrochemicals, making ExxonMobil a comprehensive player in the integrated energy industry.
General Information
Exxon Mobil Corporation
22777 Springwoods Village Parkway
Spring, TX 77389
Phone: 972-940-6000
Fax: 972-444-1433
Web: NA
Email: shareholderrelations@exxonmobil.com
| Industry | Oil and Gas - Integrated - International |
| Sector | Oils-Energy |
| Fiscal Year End | December |
| Last Reported Quarter | 3/31/2024 |
| Exp Earnings Date | 7/26/2024 |
EPS Information
| Current Quarter EPS Consensus Estimate | 2.56 |
| Current Year EPS Consensus Estimate | 9.70 |
| Estimated Long-Term EPS Growth Rate | 3.00 |
| Exp Earnings Date | 7/26/2024 |
Price and Volume Information
| Zacks Rank | |
| Yesterday's Close | 121.33 |
| 52 Week High | 123.75 |
| 52 Week Low | 95.77 |
| Beta | 0.96 |
| 20 Day Moving Average | 16,002,832.00 |
| Target Price Consensus | 131.31 |

| 4 Week | 1.48 |
| 12 Week | 15.68 |
| YTD | 17.98 |
| 4 Week | 4.55 |
| 12 Week | 12.48 |
| YTD | 14.66 |
| Shares Outstanding (millions) | 3,958.26 |
| Market Capitalization (millions) | 466,916.41 |
| Short Ratio | NA |
| Last Split Date | 7/19/2001 |
| Dividend Yield | 3.22% |
| Annual Dividend | $3.80 |
| Payout Ratio | 0.43 |
| Change in Payout Ratio | -3.70 |
| Last Dividend Payout / Amount | 2/13/2024 / $0.95 |
Fundamental Ratios
| P/E (F1) | 12.16 |
| Trailing 12 Months | 13.48 |
| PEG Ratio | 4.05 |
| vs. Previous Year | -27.21% |
| vs. Previous Quarter | -16.94% |
| vs. Previous Year | -4.02% |
| vs. Previous Quarter | -1.50% |
| Price/Book | 2.19 |
| Price/Cash Flow | 7.89 |
| Price / Sales | 1.37 |
| 3/31/24 | NA |
| 12/31/23 | 18.51 |
| 9/30/23 | 20.72 |
| 3/31/24 | NA |
| 12/31/23 | 10.42 |
| 9/30/23 | 11.57 |
| 3/31/24 | NA |
| 12/31/23 | 1.48 |
| 9/30/23 | 1.42 |
| 3/31/24 | NA |
| 12/31/23 | 1.09 |
| 9/30/23 | 1.08 |
| 3/31/24 | NA |
| 12/31/23 | 11.19 |
| 9/30/23 | 11.99 |
| 3/31/24 | NA |
| 12/31/23 | 10.45 |
| 9/30/23 | 11.56 |
| 3/31/24 | NA |
| 12/31/23 | 15.32 |
| 9/30/23 | 17.15 |
| 3/31/24 | NA |
| 12/31/23 | 53.63 |
| 9/30/23 | 52.37 |
| 3/31/24 | NA |
| 12/31/23 | 10.63 |
| 9/30/23 | 10.92 |
| 3/31/24 | NA |
| 12/31/23 | 0.18 |
| 9/30/23 | 0.18 |
| 3/31/24 | NA |
| 12/31/23 | 14.99 |
| 9/30/23 | 14.96 |

