We use cookies to understand how you use our site and to improve your experience.
This includes personalizing content and advertising.
By pressing "Accept All" or closing out of this banner, you consent to the use of all cookies and similar technologies and the sharing of information they collect with third parties.
You can reject marketing cookies by pressing "Deny Optional," but we still use essential, performance, and functional cookies.
In addition, whether you "Accept All," Deny Optional," click the X or otherwise continue to use the site, you accept our Privacy Policy and Terms of Service, revised from time to time.
You are being directed to ZacksTrade, a division of LBMZ Securities and licensed broker-dealer. ZacksTrade and Zacks.com are separate companies. The web link between the two companies is not a solicitation or offer to invest in a particular security or type of security. ZacksTrade does not endorse or adopt any particular investment strategy, any analyst opinion/rating/report or any approach to evaluating individual securities.
If you wish to go to ZacksTrade, click OK. If you do not, click Cancel.
Zacks looks at stocks recently upgraded to a “Strong Buy” rating, ranked by the Zacks Indicator Score.
Top five stocks recently earning a #1 rating includes vacation ownership, technology and energy companies.
Best stocks to buy now include Delek US, Neurocrine and ORIX.
When looking for stocks to buy, new investors often choose names they know – but there are far more potentially profitable stocks out there beyond Meta, NVIDIA, Google or other “Magnificent Seven” stocks.
Professional and institutional investors know better, looking beyond the headlines to search for stocks that are ripe to buy, no matter the company's size, industry or renown.
The Zacks Rank uses four factors related to earnings estimates to classify stocks into five groups, ranging from "Strong Buy" to "Strong Sell." The list below includes some of the latest stocks given a "Strong Buy” rating in the past two weeks, according to Zacks Equity Research, ranked by our proprietary Zacks Indicator Score.
This is our short term rating system that serves as a timeliness indicator for stocks over the next 1 to 3 months. How good is it? See rankings and related performance below.
The Zacks Industry Rank assigns a rating to each of the 265 X (Expanded) Industries based on their average Zacks Rank.
An industry with a larger percentage of Zacks Rank #1's and #2's will have a better average Zacks Rank than one with a larger percentage of Zacks Rank #4's and #5's.
The industry with the best average Zacks Rank would be considered the top industry (1 out of 265), which would place it in the top 1% of Zacks Ranked Industries. The industry with the worst average Zacks Rank (265 out of 265) would place in the bottom 1%.
The Zacks Sector Rank assigns a rating to each of the 16 Sectors based on their average Zacks Rank.
A sector with a larger percentage of Zacks Rank #1's and #2's will have a better average Zacks Rank than one with a larger percentage of Zacks Rank #4's and #5's.
The sector with the best average Zacks Rank would be considered the top sector (1 out of 16), which would place it in the top 1% of Zacks Ranked Sectors. The sector with the worst average Zacks Rank (16 out of 16) would place in the bottom 1%.
The Style Scores are a complementary set of indicators to use alongside the Zacks Rank. It allows the user to better focus on the stocks that are the best fit for his or her personal trading style.
The scores are based on the trading styles of Value, Growth, and Momentum. There's also a VGM Score ('V' for Value, 'G' for Growth and 'M' for Momentum), which combines the weighted average of the individual style scores into one score.
Value ScoreA
Growth ScoreA
Momentum ScoreA
VGM ScoreA
Within each Score, stocks are graded into five groups: A, B, C, D and F. As you might remember from your school days, an A, is better than a B; a B is better than a C; a C is better than a D; and a D is better than an F.
As an investor, you want to buy stocks with the highest probability of success. That means you want to buy stocks with a Zacks Rank #1 or #2, Strong Buy or Buy, which also has a Score of an A or a B in your personal trading style.
Zacks Earnings ESP (Expected Surprise Prediction) looks to find companies that have recently seen positive earnings estimate revision activity. The idea is that more recent information is, generally speaking, more accurate and can be a better predictor of the future, which can give investors an advantage in earnings season.
The technique has proven to be very useful for finding positive surprises. In fact, when combining a Zacks Rank #3 or better and a positive Earnings ESP, stocks produced a positive surprise 70% of the time, while they also saw 28.3% annual returns on average, according to our 10 year backtest.
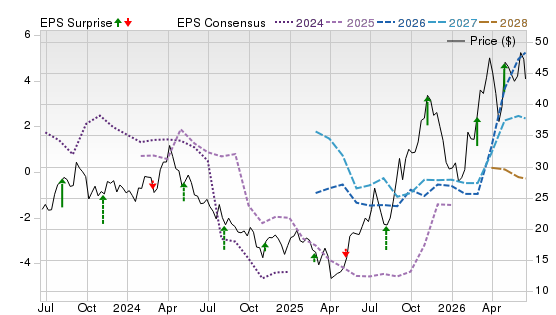
Delek US Holdings is an integrated downstream energy company with refining, midstream and marketing operations across key U.S. regions. The company should benefit from higher refinery reliability following the Big Spring turnaround, continued Enterprise Optimization Plan savings, growing free cash flow, expanding third-party midstream earnings and disciplined capital allocation through dividends and buybacks.
Potential Risks
Delek remains exposed to volatile refining margins, crude-price movements, renewable fuel compliance uncertainty, turnaround execution risks and weaker fuel demand, which could pressure profitability and shareholder returns.
Forecast
A Zacks Rank #1 (Strong Buy) signals favorable estimate revisions, while Style Scores of A for Value and Growth, and a C for Momentum suggest the setup is still fundamentally driven despite a big rebound. The chart shows price recovering sharply as 2026–2028 estimates move higher, with recent green surprise markers reinforcing the revision trend.
This is our short term rating system that serves as a timeliness indicator for stocks over the next 1 to 3 months. How good is it? See rankings and related performance below.
The Zacks Industry Rank assigns a rating to each of the 265 X (Expanded) Industries based on their average Zacks Rank.
An industry with a larger percentage of Zacks Rank #1's and #2's will have a better average Zacks Rank than one with a larger percentage of Zacks Rank #4's and #5's.
The industry with the best average Zacks Rank would be considered the top industry (1 out of 265), which would place it in the top 1% of Zacks Ranked Industries. The industry with the worst average Zacks Rank (265 out of 265) would place in the bottom 1%.
The Zacks Sector Rank assigns a rating to each of the 16 Sectors based on their average Zacks Rank.
A sector with a larger percentage of Zacks Rank #1's and #2's will have a better average Zacks Rank than one with a larger percentage of Zacks Rank #4's and #5's.
The sector with the best average Zacks Rank would be considered the top sector (1 out of 16), which would place it in the top 1% of Zacks Ranked Sectors. The sector with the worst average Zacks Rank (16 out of 16) would place in the bottom 1%.
The Style Scores are a complementary set of indicators to use alongside the Zacks Rank. It allows the user to better focus on the stocks that are the best fit for his or her personal trading style.
The scores are based on the trading styles of Value, Growth, and Momentum. There's also a VGM Score ('V' for Value, 'G' for Growth and 'M' for Momentum), which combines the weighted average of the individual style scores into one score.
Value ScoreA
Growth ScoreA
Momentum ScoreA
VGM ScoreA
Within each Score, stocks are graded into five groups: A, B, C, D and F. As you might remember from your school days, an A, is better than a B; a B is better than a C; a C is better than a D; and a D is better than an F.
As an investor, you want to buy stocks with the highest probability of success. That means you want to buy stocks with a Zacks Rank #1 or #2, Strong Buy or Buy, which also has a Score of an A or a B in your personal trading style.
Zacks Earnings ESP (Expected Surprise Prediction) looks to find companies that have recently seen positive earnings estimate revision activity. The idea is that more recent information is, generally speaking, more accurate and can be a better predictor of the future, which can give investors an advantage in earnings season.
The technique has proven to be very useful for finding positive surprises. In fact, when combining a Zacks Rank #3 or better and a positive Earnings ESP, stocks produced a positive surprise 70% of the time, while they also saw 28.3% annual returns on average, according to our 10 year backtest.
Neurocrine is a neuroscience biopharma company with commercial strength in INGREZZA and CRENESSITY. The stock’s appeal rests on reaffirmed INGREZZA 2026 sales guidance, expanding CRENESSITY opportunity, durable cash flows, a strong balance sheet and broader therapeutic diversification. Salesforce expansion, long product IP protection and multiple planned study starts and readouts could support sustainable growth while reducing dependence on a single medicine.
Potential Risks
Risks include commercialization challenges for INGREZZA and CRENESSITY, payer or pricing controls, reimbursement limits, competition including generics, adverse regulatory decisions, clinical delays or failures, third-party dependence and uncertainty around realizing expected acquisition benefits.
Forecast
A Zacks Rank #1 is constructive, and C Value, B Growth and A Momentum indicate earnings revisions are being supported by strong share performance. The chart shows a sustained price recovery, rising out-year consensus lines and a mostly beat-leaning surprise pattern, though expectations now look materially higher.
This is our short term rating system that serves as a timeliness indicator for stocks over the next 1 to 3 months. How good is it? See rankings and related performance below.
The Zacks Industry Rank assigns a rating to each of the 265 X (Expanded) Industries based on their average Zacks Rank.
An industry with a larger percentage of Zacks Rank #1's and #2's will have a better average Zacks Rank than one with a larger percentage of Zacks Rank #4's and #5's.
The industry with the best average Zacks Rank would be considered the top industry (1 out of 265), which would place it in the top 1% of Zacks Ranked Industries. The industry with the worst average Zacks Rank (265 out of 265) would place in the bottom 1%.
The Zacks Sector Rank assigns a rating to each of the 16 Sectors based on their average Zacks Rank.
A sector with a larger percentage of Zacks Rank #1's and #2's will have a better average Zacks Rank than one with a larger percentage of Zacks Rank #4's and #5's.
The sector with the best average Zacks Rank would be considered the top sector (1 out of 16), which would place it in the top 1% of Zacks Ranked Sectors. The sector with the worst average Zacks Rank (16 out of 16) would place in the bottom 1%.
The Style Scores are a complementary set of indicators to use alongside the Zacks Rank. It allows the user to better focus on the stocks that are the best fit for his or her personal trading style.
The scores are based on the trading styles of Value, Growth, and Momentum. There's also a VGM Score ('V' for Value, 'G' for Growth and 'M' for Momentum), which combines the weighted average of the individual style scores into one score.
Value ScoreA
Growth ScoreA
Momentum ScoreA
VGM ScoreA
Within each Score, stocks are graded into five groups: A, B, C, D and F. As you might remember from your school days, an A, is better than a B; a B is better than a C; a C is better than a D; and a D is better than an F.
As an investor, you want to buy stocks with the highest probability of success. That means you want to buy stocks with a Zacks Rank #1 or #2, Strong Buy or Buy, which also has a Score of an A or a B in your personal trading style.
Zacks Earnings ESP (Expected Surprise Prediction) looks to find companies that have recently seen positive earnings estimate revision activity. The idea is that more recent information is, generally speaking, more accurate and can be a better predictor of the future, which can give investors an advantage in earnings season.
The technique has proven to be very useful for finding positive surprises. In fact, when combining a Zacks Rank #3 or better and a positive Earnings ESP, stocks produced a positive surprise 70% of the time, while they also saw 28.3% annual returns on average, according to our 10 year backtest.
ORIX is a diversified Japanese financial-services group pursuing portfolio optimization, asset rotation and business-model transformation. Its focus on alternative investments, operations, business solutions, real assets, aircraft leasing, private equity and asset management could support long-term profit growth. Management also aims to improve capital efficiency, expand fee income and balance growth investments with shareholder returns, strengthening its appeal.
Potential Risks
Risks include geopolitical pressure on inbound businesses, China exposure controls, U.S. credit costs, slower asset recycling, high investment valuations, sudden interest-rate hikes and possible Middle East-related airline or macro weakness.
Forecast
A Zacks Rank #1 supports a positive revision backdrop. The Style Scores of A for Value and Momentum are compelling, though the F Growth score argues for discipline. The chart shows a long price advance, sharply rising 2027–2028 estimates and improving surprise markers, suggesting sentiment has caught up with stronger profit expectations.
This is our short term rating system that serves as a timeliness indicator for stocks over the next 1 to 3 months. How good is it? See rankings and related performance below.
The Zacks Industry Rank assigns a rating to each of the 265 X (Expanded) Industries based on their average Zacks Rank.
An industry with a larger percentage of Zacks Rank #1's and #2's will have a better average Zacks Rank than one with a larger percentage of Zacks Rank #4's and #5's.
The industry with the best average Zacks Rank would be considered the top industry (1 out of 265), which would place it in the top 1% of Zacks Ranked Industries. The industry with the worst average Zacks Rank (265 out of 265) would place in the bottom 1%.
The Zacks Sector Rank assigns a rating to each of the 16 Sectors based on their average Zacks Rank.
A sector with a larger percentage of Zacks Rank #1's and #2's will have a better average Zacks Rank than one with a larger percentage of Zacks Rank #4's and #5's.
The sector with the best average Zacks Rank would be considered the top sector (1 out of 16), which would place it in the top 1% of Zacks Ranked Sectors. The sector with the worst average Zacks Rank (16 out of 16) would place in the bottom 1%.
The Style Scores are a complementary set of indicators to use alongside the Zacks Rank. It allows the user to better focus on the stocks that are the best fit for his or her personal trading style.
The scores are based on the trading styles of Value, Growth, and Momentum. There's also a VGM Score ('V' for Value, 'G' for Growth and 'M' for Momentum), which combines the weighted average of the individual style scores into one score.
Value ScoreA
Growth ScoreA
Momentum ScoreA
VGM ScoreA
Within each Score, stocks are graded into five groups: A, B, C, D and F. As you might remember from your school days, an A, is better than a B; a B is better than a C; a C is better than a D; and a D is better than an F.
As an investor, you want to buy stocks with the highest probability of success. That means you want to buy stocks with a Zacks Rank #1 or #2, Strong Buy or Buy, which also has a Score of an A or a B in your personal trading style.
Zacks Earnings ESP (Expected Surprise Prediction) looks to find companies that have recently seen positive earnings estimate revision activity. The idea is that more recent information is, generally speaking, more accurate and can be a better predictor of the future, which can give investors an advantage in earnings season.
The technique has proven to be very useful for finding positive surprises. In fact, when combining a Zacks Rank #3 or better and a positive Earnings ESP, stocks produced a positive surprise 70% of the time, while they also saw 28.3% annual returns on average, according to our 10 year backtest.
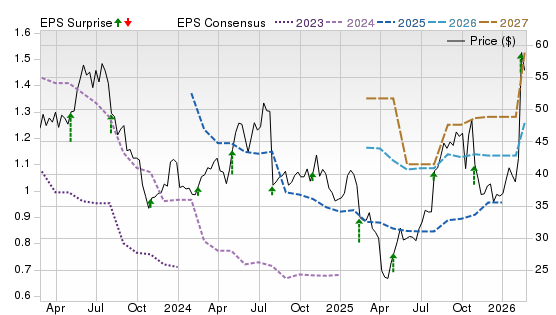
Navigator Holdings is a handysize liquefied-gas shipping company serving global energy and petrochemical trade. The company could benefit from stronger North American ethane and ethylene exports, record terminal momentum, rising utilization and tight handysize vessel supply. Its low cash breakeven and disciplined fleet renewal may support cash generation, shareholder returns and earnings resilience if favorable shipping and terminal conditions continue.
Potential Risks
Risks include volatile freight rates, geopolitical disruption, terminal throughput limits in hotter months, commodity-price swings, timing of vessel sales, debt needs, and uncertainty around sustaining elevated ethylene export demand.
Forecast
A Zacks Rank #1 points to positive estimate revisions, but B Value, F Growth and A Momentum describe a stock driven more by asset value and rate momentum than steady growth. The chart shows volatile price action, rising 2026–2028 consensus lines and recent positive surprise markers, implying expectations are improving but remain tied to shipping-cycle durability.
This is our short term rating system that serves as a timeliness indicator for stocks over the next 1 to 3 months. How good is it? See rankings and related performance below.
The Zacks Industry Rank assigns a rating to each of the 265 X (Expanded) Industries based on their average Zacks Rank.
An industry with a larger percentage of Zacks Rank #1's and #2's will have a better average Zacks Rank than one with a larger percentage of Zacks Rank #4's and #5's.
The industry with the best average Zacks Rank would be considered the top industry (1 out of 265), which would place it in the top 1% of Zacks Ranked Industries. The industry with the worst average Zacks Rank (265 out of 265) would place in the bottom 1%.
The Zacks Sector Rank assigns a rating to each of the 16 Sectors based on their average Zacks Rank.
A sector with a larger percentage of Zacks Rank #1's and #2's will have a better average Zacks Rank than one with a larger percentage of Zacks Rank #4's and #5's.
The sector with the best average Zacks Rank would be considered the top sector (1 out of 16), which would place it in the top 1% of Zacks Ranked Sectors. The sector with the worst average Zacks Rank (16 out of 16) would place in the bottom 1%.
The Style Scores are a complementary set of indicators to use alongside the Zacks Rank. It allows the user to better focus on the stocks that are the best fit for his or her personal trading style.
The scores are based on the trading styles of Value, Growth, and Momentum. There's also a VGM Score ('V' for Value, 'G' for Growth and 'M' for Momentum), which combines the weighted average of the individual style scores into one score.
Value ScoreA
Growth ScoreA
Momentum ScoreA
VGM ScoreA
Within each Score, stocks are graded into five groups: A, B, C, D and F. As you might remember from your school days, an A, is better than a B; a B is better than a C; a C is better than a D; and a D is better than an F.
As an investor, you want to buy stocks with the highest probability of success. That means you want to buy stocks with a Zacks Rank #1 or #2, Strong Buy or Buy, which also has a Score of an A or a B in your personal trading style.
Zacks Earnings ESP (Expected Surprise Prediction) looks to find companies that have recently seen positive earnings estimate revision activity. The idea is that more recent information is, generally speaking, more accurate and can be a better predictor of the future, which can give investors an advantage in earnings season.
The technique has proven to be very useful for finding positive surprises. In fact, when combining a Zacks Rank #3 or better and a positive Earnings ESP, stocks produced a positive surprise 70% of the time, while they also saw 28.3% annual returns on average, according to our 10 year backtest.
Cognex provides machine-vision technology for automation across logistics, packaging, consumer electronics, automotive and semiconductor markets. Its growth outlook could benefit from broader factory-automation demand, continued logistics strength, consumer-electronics seasonality and higher semiconductor expectations. New AI vision systems, portfolio optimization and planned cost reductions should support technology leadership, margin expansion and cash generation, making the stock attractive for investors.
Potential Risks
The company’s risks include tariffs, China exposure, cyclical customer spending, supply-chain delays, large-customer weakness, product obsolescence, cybersecurity threats and failure to execute cost reductions.
Forecast
A Zacks Rank #1 is the key positive because it reflects improving estimates, while F Value, B Growth and F Momentum make this a more selective idea. The chart shows a powerful price breakout, erratic out-year consensus lines and a recent green surprise marker, indicating better fundamentals but also elevated expectation risk.
It’s important to understand what this list is, and what it isn’t.
For decades, the Zacks Rank has been a proven system that has helped investors identify stocks most likely to outperform. Instead of relying on hunches or hype, it’s grounded in earnings estimate revisions — a factor strongly correlated with stock price movement. When combined with additional fundamental metrics, the approach becomes even more powerful.
Still, it’s important to understand these basics:
While the list offers exposure across several industries, it is not a fully diversified portfolio. You should think of it as a starting point, not a complete investing strategy.
Even though these stocks are backed by a proven system, nothing protects you from short-term downside. Depending on market conditions, most — or even all — could decline in the near term.
The Zacks Rank works because it captures trends in earnings momentum. That power plays out over weeks and months, not days. Investors with patience and discipline are more likely to benefit.
Before buying any single stock, check how it aligns with your goals, risk tolerance, and broader portfolio.
Methodology
The Zacks Rank is a proprietary stock-rating model that uses trends in earnings estimate revisions and earnings-per-share (EPS) surprises to classify stocks into five groups: #1 (Strong Buy), #2 (Buy), #3 (Hold), #4 (Sell) and #5 (Strong Sell). The Zacks Rank is calculated through four primary factors related to earnings estimates: analysts' consensus on earnings estimate revisions, the magnitude of revision change, the upside potential and estimate surprise (or the degree in which earnings per share deviated from the previous quarter).
Zacks builds the data from 3,000 analysts at over 150 different brokerage firms. The average yearly gain for Zacks Rank #1 (Strong Buy) stocks is +23.94% per year from January 1, 1988, through June 1, 2026.
Zacks' 7 Best Strong Buy Stocks (New Research Report)
Valued at $99, click below to receive our just-released report predicting the 7 stocks that will soar highest in the coming month. Default
For this list, only companies in the top 50% of industries that have average daily trading volumes of 100,000 shares or more were considered. Stocks with a share value of $5 or less were excluded. These companies earned Zacks Rank #1 (Strong Buy) between June 15, 2026 and June 27, 2026. All information is current as of market open, June 29, 2026.
Common Questions of New Investors
Where to Buy Stocks
To invest in stocks, you must open a brokerage account, fund the account and purchase stocks through your selected brokerage. Investors may also purchase stocks through a financial advisor or an automated robo advisor. Some publicly traded companies also offer a direct stock purchase plan, where you can purchase shares directly from the company.
Alternative Ways to Invest in Stocks
You can also invest in stock funds, such as mutual funds, index funds and exchange-traded funds, where the fund managers select the pool of stocks that follow an investing strategy. These funds may broadly cover an entire index, such as the S&P 500, or specific types of stocks, such as industries like technology and energy companies, company size such as small cap companies, or location like international companies.
How to Start Investing in Stocks Today
It’s easy to start investing by opening an online brokerage account. Opening a standard brokerage account takes about 20 minutes and you’ll need to have some personal information ready, such as your social security number and your bank details to fund your account.
You’ll need to decide whether to open a taxable account (most common), a tax-deferred retirement account such as a traditional IRA or a tax-free retirement account such as a Roth IRA, which is funded with after-tax dollars, but qualified withdrawals are tax-free. A margin account allows for borrowing to purchase stocks and is best for experienced traders.
Set goals before you begin investing – determine how much you can afford to invest and your tolerance for risk.
What to Look for When You Buy Stocks?
The goal in all equities investment is to buy low and sell high, growing your wealth over time. Researching the companies to invest in is key – what kind of product or service do they offer? How do they compare with competitors? How fast are they growing? Does the stock pay regular dividends to shareholders? Does the stock help diversify your portfolio by giving you exposure to a market segment you currently don’t hold?
Understanding fundamental analysis can help determine whether the stock has the potential for growth at its current purchase price. Factors that can help determine that include earnings per share (EPS), price-to-earnings ratio and PE growth. Technical analysis is used looking at statistical patterns to potentially predict future price moves. Some investors may look for a growth and income strategy, looking for stocks with solid revenues that pay good dividends, or a value strategy, looking if a current stock price is below what their revenue, EPS and other factors suggest.
Analysts also often look for the momentum of a stock by looking at moving averages of a stock's closing price over a 50-day, 100-day or 12-month trailing time period to determine signals whether to buy or sell a stock.


 Hold
Hold 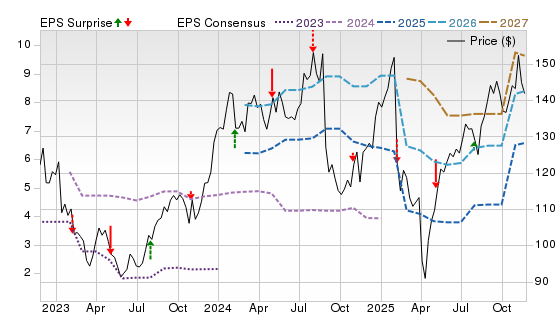
 Strong Buy
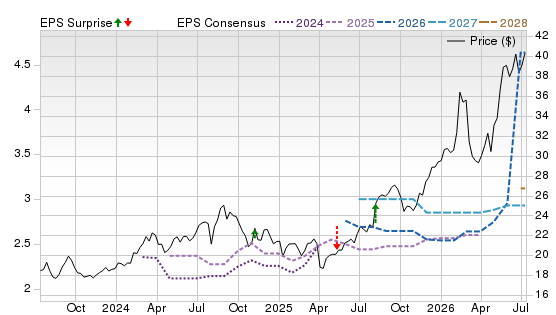


Zacks' 7 Best Strong Buy Stocks (New Research Report)
Valued at $99, click below to receive our just-released report predicting the 7 stocks that will soar highest in the coming month. Default
Click Here, It's Really Free