We use cookies to understand how you use our site and to improve your experience.
This includes personalizing content and advertising.
By pressing "Accept All" or closing out of this banner, you consent to the use of all cookies and similar technologies and the sharing of information they collect with third parties.
You can reject marketing cookies by pressing "Deny Optional," but we still use essential, performance, and functional cookies.
In addition, whether you "Accept All," Deny Optional," click the X or otherwise continue to use the site, you accept our Privacy Policy and Terms of Service, revised from time to time.
You are being directed to ZacksTrade, a division of LBMZ Securities and licensed broker-dealer. ZacksTrade and Zacks.com are separate companies. The web link between the two companies is not a solicitation or offer to invest in a particular security or type of security. ZacksTrade does not endorse or adopt any particular investment strategy, any analyst opinion/rating/report or any approach to evaluating individual securities.
If you wish to go to ZacksTrade, click OK. If you do not, click Cancel.
Global oil markets in 2026 are defined by a delicate balance of steady demand growth and geopolitical risk.
The sector performs best when prices are stable or gradually rising—not when volatility dominates.
Top oil stocks to buy today include BP, Repsol and Par Pacific Holdings.
Oil stocks remain a core segment of the global energy market, offering investors exposure to commodity-driven cash flows, dividends, and inflation-sensitive assets. While the sector is inherently cyclical, years of disciplined capital spending, balance-sheet repair, and shareholder-friendly policies have reshaped oil investing into a more cash-return-focused story than in past booms.
Oil Stock Market Overview and Forecast
Global oil markets in 2026 are defined by a delicate balance of steady demand growth from emerging economies, measured supply from OPEC+ producers, and persistent geopolitical risk in key exporting regions. International energy data and U.S. inventory trends continue to show seasonal stockpile swings, underscoring how sensitive crude prices remain to short-term supply disruptions and macroeconomic shifts.
At the same time, U.S. shale output, once synonymous with rapid expansion, is growing more selectively, with producers emphasizing capital discipline over volume growth. As a result, most analysts expect oil prices to remain range-bound rather than surge dramatically, a backdrop that tends to favor companies with low production costs, resilient balance sheets, and consistent free cash flow over growth-at-any-cost drillers.
Is now a good time to invest in oil stocks?
Historically, the sector performs best when prices are stable or gradually rising—not when volatility dominates headlines. In 2026, oil stocks increasingly appeal to income-oriented and value-focused investors seeking durable dividends, share repurchases, and prudent capital allocation.
Below, we analyze and rank the best oil stocks using a blend of Zacks Rank signals, Style Scores, and fundamental metrics to identify compelling opportunities in today’s market.
This is our short term rating system that serves as a timeliness indicator for stocks over the next 1 to 3 months. How good is it? See rankings and related performance below.
The Zacks Industry Rank assigns a rating to each of the 265 X (Expanded) Industries based on their average Zacks Rank.
An industry with a larger percentage of Zacks Rank #1's and #2's will have a better average Zacks Rank than one with a larger percentage of Zacks Rank #4's and #5's.
The industry with the best average Zacks Rank would be considered the top industry (1 out of 265), which would place it in the top 1% of Zacks Ranked Industries. The industry with the worst average Zacks Rank (265 out of 265) would place in the bottom 1%.
The Zacks Sector Rank assigns a rating to each of the 16 Sectors based on their average Zacks Rank.
A sector with a larger percentage of Zacks Rank #1's and #2's will have a better average Zacks Rank than one with a larger percentage of Zacks Rank #4's and #5's.
The sector with the best average Zacks Rank would be considered the top sector (1 out of 16), which would place it in the top 1% of Zacks Ranked Sectors. The sector with the worst average Zacks Rank (16 out of 16) would place in the bottom 1%.
The Style Scores are a complementary set of indicators to use alongside the Zacks Rank. It allows the user to better focus on the stocks that are the best fit for his or her personal trading style.
The scores are based on the trading styles of Value, Growth, and Momentum. There's also a VGM Score ('V' for Value, 'G' for Growth and 'M' for Momentum), which combines the weighted average of the individual style scores into one score.
Value ScoreA
Growth ScoreA
Momentum ScoreA
VGM ScoreA
Within each Score, stocks are graded into five groups: A, B, C, D and F. As you might remember from your school days, an A, is better than a B; a B is better than a C; a C is better than a D; and a D is better than an F.
As an investor, you want to buy stocks with the highest probability of success. That means you want to buy stocks with a Zacks Rank #1 or #2, Strong Buy or Buy, which also has a Score of an A or a B in your personal trading style.
Zacks Earnings ESP (Expected Surprise Prediction) looks to find companies that have recently seen positive earnings estimate revision activity. The idea is that more recent information is, generally speaking, more accurate and can be a better predictor of the future, which can give investors an advantage in earnings season.
The technique has proven to be very useful for finding positive surprises. In fact, when combining a Zacks Rank #3 or better and a positive Earnings ESP, stocks produced a positive surprise 70% of the time, while they also saw 28.3% annual returns on average, according to our 10 year backtest.
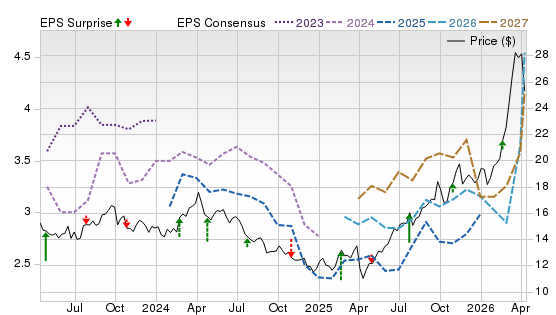
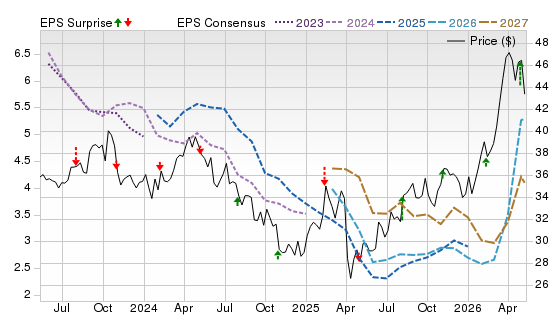
BP is an integrated major with oil exposure across upstream production, refining, marketing and trading. In Q1 2026, oil production and operations earnings were steady sequentially and the gas and low carbon unit swung back to profit, reflecting better reliability and a firmer price backdrop. With divestments narrowing the portfolio, dividends and buybacks remain the key bridge between today’s cash flow and the transition plan.
Potential Risks
Results remain highly sensitive to crude prices, refining margins, and working capital shifts. Strategy changes, geopolitical events, and regulatory or litigation risks can also impact valuation.
Forecast
A Zacks Rank #1 (Strong Buy) points to favorable earnings revision momentum. A Value Score of A and a VGM Score of A indicate strong fundamentals, but a Momentum Score of D signals choppy trading. On the Price, Consensus & EPS Surprise chart, price has spiked, forward consensus has turned higher, and the most recent surprises are mixed but improving.
This is our short term rating system that serves as a timeliness indicator for stocks over the next 1 to 3 months. How good is it? See rankings and related performance below.
The Zacks Industry Rank assigns a rating to each of the 265 X (Expanded) Industries based on their average Zacks Rank.
An industry with a larger percentage of Zacks Rank #1's and #2's will have a better average Zacks Rank than one with a larger percentage of Zacks Rank #4's and #5's.
The industry with the best average Zacks Rank would be considered the top industry (1 out of 265), which would place it in the top 1% of Zacks Ranked Industries. The industry with the worst average Zacks Rank (265 out of 265) would place in the bottom 1%.
The Zacks Sector Rank assigns a rating to each of the 16 Sectors based on their average Zacks Rank.
A sector with a larger percentage of Zacks Rank #1's and #2's will have a better average Zacks Rank than one with a larger percentage of Zacks Rank #4's and #5's.
The sector with the best average Zacks Rank would be considered the top sector (1 out of 16), which would place it in the top 1% of Zacks Ranked Sectors. The sector with the worst average Zacks Rank (16 out of 16) would place in the bottom 1%.
The Style Scores are a complementary set of indicators to use alongside the Zacks Rank. It allows the user to better focus on the stocks that are the best fit for his or her personal trading style.
The scores are based on the trading styles of Value, Growth, and Momentum. There's also a VGM Score ('V' for Value, 'G' for Growth and 'M' for Momentum), which combines the weighted average of the individual style scores into one score.
Value ScoreA
Growth ScoreA
Momentum ScoreA
VGM ScoreA
Within each Score, stocks are graded into five groups: A, B, C, D and F. As you might remember from your school days, an A, is better than a B; a B is better than a C; a C is better than a D; and a D is better than an F.
As an investor, you want to buy stocks with the highest probability of success. That means you want to buy stocks with a Zacks Rank #1 or #2, Strong Buy or Buy, which also has a Score of an A or a B in your personal trading style.
Zacks Earnings ESP (Expected Surprise Prediction) looks to find companies that have recently seen positive earnings estimate revision activity. The idea is that more recent information is, generally speaking, more accurate and can be a better predictor of the future, which can give investors an advantage in earnings season.
The technique has proven to be very useful for finding positive surprises. In fact, when combining a Zacks Rank #3 or better and a positive Earnings ESP, stocks produced a positive surprise 70% of the time, while they also saw 28.3% annual returns on average, according to our 10 year backtest.
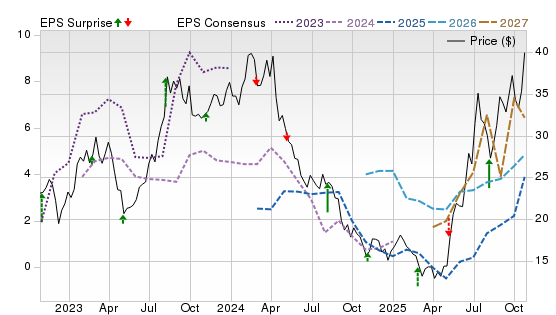
Repsol is an integrated European energy company with oil exposure in upstream and a large refining and marketing system. In Q1 2026, adjusted earnings improved year over year, supported by resilient refining and trading and steady customer oriented cash flow, while the company kept advancing renewables and power retail. That blend can soften commodity swings and support a shareholder return framework that remains central to the story.
Potential Risks
Downstream margins can normalize quickly, and upstream volumes depend on project execution across multiple jurisdictions. Higher net debt or working capital builds can tighten flexibility if oil prices cool, and Europe’s policy backdrop can change incentives.
Forecast
A Zacks Rank #1 reflects upward estimate revisions. A Value Score of A and a VGM Score of A are constructive, while a Growth Score of C suggests investors want clearer acceleration. The chart shows the stock rebounding as forward consensus lines rise and recent surprises tilt more positive.
This is our short term rating system that serves as a timeliness indicator for stocks over the next 1 to 3 months. How good is it? See rankings and related performance below.
The Zacks Industry Rank assigns a rating to each of the 265 X (Expanded) Industries based on their average Zacks Rank.
An industry with a larger percentage of Zacks Rank #1's and #2's will have a better average Zacks Rank than one with a larger percentage of Zacks Rank #4's and #5's.
The industry with the best average Zacks Rank would be considered the top industry (1 out of 265), which would place it in the top 1% of Zacks Ranked Industries. The industry with the worst average Zacks Rank (265 out of 265) would place in the bottom 1%.
The Zacks Sector Rank assigns a rating to each of the 16 Sectors based on their average Zacks Rank.
A sector with a larger percentage of Zacks Rank #1's and #2's will have a better average Zacks Rank than one with a larger percentage of Zacks Rank #4's and #5's.
The sector with the best average Zacks Rank would be considered the top sector (1 out of 16), which would place it in the top 1% of Zacks Ranked Sectors. The sector with the worst average Zacks Rank (16 out of 16) would place in the bottom 1%.
The Style Scores are a complementary set of indicators to use alongside the Zacks Rank. It allows the user to better focus on the stocks that are the best fit for his or her personal trading style.
The scores are based on the trading styles of Value, Growth, and Momentum. There's also a VGM Score ('V' for Value, 'G' for Growth and 'M' for Momentum), which combines the weighted average of the individual style scores into one score.
Value ScoreA
Growth ScoreA
Momentum ScoreA
VGM ScoreA
Within each Score, stocks are graded into five groups: A, B, C, D and F. As you might remember from your school days, an A, is better than a B; a B is better than a C; a C is better than a D; and a D is better than an F.
As an investor, you want to buy stocks with the highest probability of success. That means you want to buy stocks with a Zacks Rank #1 or #2, Strong Buy or Buy, which also has a Score of an A or a B in your personal trading style.
Zacks Earnings ESP (Expected Surprise Prediction) looks to find companies that have recently seen positive earnings estimate revision activity. The idea is that more recent information is, generally speaking, more accurate and can be a better predictor of the future, which can give investors an advantage in earnings season.
The technique has proven to be very useful for finding positive surprises. In fact, when combining a Zacks Rank #3 or better and a positive Earnings ESP, stocks produced a positive surprise 70% of the time, while they also saw 28.3% annual returns on average, according to our 10 year backtest.
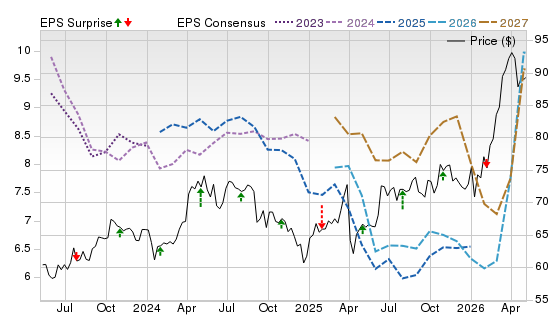
Par Pacific is a U.S. downstream operator with oil exposure through refining, logistics and retail, centered on Hawaii. In Q1 2026, the company returned to profitability as refining throughput hit a first-quarter record and management highlighted improved reliability and commercial execution. Share repurchases continued, and the Hawaii renewable fuels facility began commercial operations in April, adding a new lever tied to renewable diesel and aviation fuel.
Potential Risks
Par is highly sensitive to regional crack spreads, outages and demand shifts, so earnings can swing sharply. Renewable fuels economics rely on feedstock and credit values, and any ramp issues could hurt confidence. After a strong run, expectations are less forgiving.
Forecast
A Zacks Rank #1 signals rising estimates. A Value Score of A and a VGM Score of A support the setup, but a Momentum Score of D implies volatility. The chart shows a steep price move with forward consensus turning up and recent surprises uneven but improving.
This is our short term rating system that serves as a timeliness indicator for stocks over the next 1 to 3 months. How good is it? See rankings and related performance below.
The Zacks Industry Rank assigns a rating to each of the 265 X (Expanded) Industries based on their average Zacks Rank.
An industry with a larger percentage of Zacks Rank #1's and #2's will have a better average Zacks Rank than one with a larger percentage of Zacks Rank #4's and #5's.
The industry with the best average Zacks Rank would be considered the top industry (1 out of 265), which would place it in the top 1% of Zacks Ranked Industries. The industry with the worst average Zacks Rank (265 out of 265) would place in the bottom 1%.
The Zacks Sector Rank assigns a rating to each of the 16 Sectors based on their average Zacks Rank.
A sector with a larger percentage of Zacks Rank #1's and #2's will have a better average Zacks Rank than one with a larger percentage of Zacks Rank #4's and #5's.
The sector with the best average Zacks Rank would be considered the top sector (1 out of 16), which would place it in the top 1% of Zacks Ranked Sectors. The sector with the worst average Zacks Rank (16 out of 16) would place in the bottom 1%.
The Style Scores are a complementary set of indicators to use alongside the Zacks Rank. It allows the user to better focus on the stocks that are the best fit for his or her personal trading style.
The scores are based on the trading styles of Value, Growth, and Momentum. There's also a VGM Score ('V' for Value, 'G' for Growth and 'M' for Momentum), which combines the weighted average of the individual style scores into one score.
Value ScoreA
Growth ScoreA
Momentum ScoreA
VGM ScoreA
Within each Score, stocks are graded into five groups: A, B, C, D and F. As you might remember from your school days, an A, is better than a B; a B is better than a C; a C is better than a D; and a D is better than an F.
As an investor, you want to buy stocks with the highest probability of success. That means you want to buy stocks with a Zacks Rank #1 or #2, Strong Buy or Buy, which also has a Score of an A or a B in your personal trading style.
Zacks Earnings ESP (Expected Surprise Prediction) looks to find companies that have recently seen positive earnings estimate revision activity. The idea is that more recent information is, generally speaking, more accurate and can be a better predictor of the future, which can give investors an advantage in earnings season.
The technique has proven to be very useful for finding positive surprises. In fact, when combining a Zacks Rank #3 or better and a positive Earnings ESP, stocks produced a positive surprise 70% of the time, while they also saw 28.3% annual returns on average, according to our 10 year backtest.
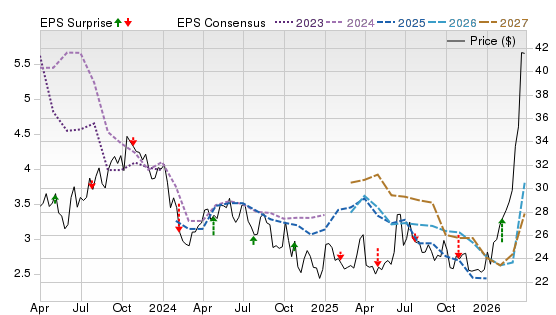
Shell is a global integrated major with oil exposure across upstream, refining and a large trading engine, alongside a leading LNG position. In Q1 2026, Shell reported strong profitability and lifted shareholder distributions, underscoring how trading and integrated supply can monetize volatility when markets are disrupted. That resilience can help fund disciplined capital returns while the company refreshes its portfolio and advances lower carbon options.
Potential Risks
Operations and prices remain exposed to geopolitical conflict, shipping disruptions and OPEC driven swings, while refining and chemicals cycles can turn quickly. Policy, litigation and reserve replacement debates can also weigh on sentiment even in strong tape.
Forecast
A Zacks Rank #1 indicates favorable revisions. A Value Score of A and a VGM Score of A look supportive, while a Growth Score of C implies moderation. The chart shows a powerful price breakout, forward consensus rising, and a pattern of recent beats that helped reinforce momentum.
This is our short term rating system that serves as a timeliness indicator for stocks over the next 1 to 3 months. How good is it? See rankings and related performance below.
The Zacks Industry Rank assigns a rating to each of the 265 X (Expanded) Industries based on their average Zacks Rank.
An industry with a larger percentage of Zacks Rank #1's and #2's will have a better average Zacks Rank than one with a larger percentage of Zacks Rank #4's and #5's.
The industry with the best average Zacks Rank would be considered the top industry (1 out of 265), which would place it in the top 1% of Zacks Ranked Industries. The industry with the worst average Zacks Rank (265 out of 265) would place in the bottom 1%.
The Zacks Sector Rank assigns a rating to each of the 16 Sectors based on their average Zacks Rank.
A sector with a larger percentage of Zacks Rank #1's and #2's will have a better average Zacks Rank than one with a larger percentage of Zacks Rank #4's and #5's.
The sector with the best average Zacks Rank would be considered the top sector (1 out of 16), which would place it in the top 1% of Zacks Ranked Sectors. The sector with the worst average Zacks Rank (16 out of 16) would place in the bottom 1%.
The Style Scores are a complementary set of indicators to use alongside the Zacks Rank. It allows the user to better focus on the stocks that are the best fit for his or her personal trading style.
The scores are based on the trading styles of Value, Growth, and Momentum. There's also a VGM Score ('V' for Value, 'G' for Growth and 'M' for Momentum), which combines the weighted average of the individual style scores into one score.
Value ScoreA
Growth ScoreA
Momentum ScoreA
VGM ScoreA
Within each Score, stocks are graded into five groups: A, B, C, D and F. As you might remember from your school days, an A, is better than a B; a B is better than a C; a C is better than a D; and a D is better than an F.
As an investor, you want to buy stocks with the highest probability of success. That means you want to buy stocks with a Zacks Rank #1 or #2, Strong Buy or Buy, which also has a Score of an A or a B in your personal trading style.
Zacks Earnings ESP (Expected Surprise Prediction) looks to find companies that have recently seen positive earnings estimate revision activity. The idea is that more recent information is, generally speaking, more accurate and can be a better predictor of the future, which can give investors an advantage in earnings season.
The technique has proven to be very useful for finding positive surprises. In fact, when combining a Zacks Rank #3 or better and a positive Earnings ESP, stocks produced a positive surprise 70% of the time, while they also saw 28.3% annual returns on average, according to our 10 year backtest.
Equinor is Norway’s energy major with oil exposure on the Norwegian continental shelf and a sizable gas portfolio serving Europe. In Q1 2026, Equinor delivered strong earnings and maintained a competitive capital distribution, reflecting solid operations and supportive pricing. Its advantaged resource base and balance between oil, gas and selective renewables can appeal to investors seeking cash generation with some transition optionality.
Potential Risks
The stock remains tightly linked to oil and gas prices, and any sharp reversal can quickly pressure cash flow and sentiment. Offshore project inflation, unplanned downtime, and Norwegian tax or regulatory shifts could also erode returns.
Forecast
A Zacks Rank #1 suggests estimates are moving higher. A Value Score of A, Growth Score of A and VGM Score of A are strong signals, with a Momentum Score of C indicating steadier trading. The chart shows a rapid price jump, forward consensus firming, and recent surprises improving versus earlier quarters.
The Zacks Rank is a proprietary stock-rating model that uses trends in earnings estimate revisions and earnings-per-share (EPS) surprises to classify stocks into five groups: #1 (Strong Buy), #2 (Buy), #3 (Hold), #4 (Sell) and #5 (Strong Sell). The Zacks Rank is calculated through four primary factors related to earnings estimates: analysts' consensus on earnings estimate revisions, the magnitude of revision change, the upside potential and estimate surprise (or the degree in which earnings per share deviated from the previous quarter).
Zacks builds the data from 3,000 analysts at over 150 different brokerage firms. The average yearly gain for Zacks Rank #1 (Strong Buy) stocks is +23.62% per year from January, 1988, through June 2, 2025.
Selections for Best Oil Stocks are based on the current top ranking stocks out of 343 stocks based on Zacks Indicator Score, Style Scores and fundamentals. All stocks have a daily trading volume of at least 100,000 shares and has a stock price of at least $5. All information is current as of market open, May 12, 2026.
Understanding Oil Stocks
Oil stocks represent companies involved in discovering, producing, transporting, refining, or selling petroleum products. Each segment reacts differently to oil price changes and economic cycles.
Types of oil stocks
Upstream oil stocks
Upstream companies focus on exploration and production (E&P). Their earnings are most sensitive to crude oil prices.
Oil prices directly influence upstream profits, indirectly affect refiners through input costs, and have limited impact on midstream cash flows. Stock performance depends not just on oil prices but also on hedging, cost structure, and capital allocation.
Are oil stocks good long-term investments?
Oil stocks can be long-term holdings when purchased at reasonable valuations and paired with dividend reinvestment. However, long-term returns tend to trail high-growth sectors unless investors emphasize income and valuation discipline.
Are oil stocks good during inflation or recessions?
Oil stocks often perform well during inflationary periods because energy prices rise alongside costs. During recessions, demand declines can pressure oil prices, making defensive, dividend-paying companies more attractive than cyclical producers.
How volatile are oil stocks compared to other energy stocks?
Oil producers are generally more volatile than utilities or renewable energy stocks but less volatile than early-stage clean-energy firms. Integrated majors tend to be the least volatile within the oil sector. (See our picks for Best Energy Stocks to buy now.)
How will renewable energy trends affect oil stocks?
Renewables are a long-term competitive force, but oil demand remains supported by transportation, petrochemicals, and emerging markets. Many oil majors are investing selectively in low-carbon technologies to diversify future revenue streams.
How to Evaluate Oil Stocks
What metrics should I look at when evaluating oil stocks?
Key metrics include:
Free cash flow yield.
Break-even oil price.
Debt-to-equity ratio.
Reserve life index.
Dividend payout sustainability.
Capital return policies (dividends and buybacks).
How to analyze an oil company’s reserves and production growth?
Investors should examine proven reserves, reserve replacement ratios, and production growth guidance. Companies that replace reserves without excessive spending are generally higher quality.
How to Compare Oil Stocks
Oil stocks vs. natural gas stocks: What’s better?
Oil stocks offer broader global demand exposure, while natural gas stocks are often tied to regional pricing and LNG exports. Oil tends to be more geopolitically sensitive, while gas is more infrastructure-driven.
Oil stocks vs. energy ETFs: What’s better?
Individual oil stocks allow targeted exposure and income strategies, while energy ETFs provide diversification and lower company-specific risk.
Are oil ETFs better than buying individual oil stocks?
ETFs such as broad energy or oil-focused funds can reduce volatility, but they dilute high performers. Stock pickers may prefer individual companies with superior capital discipline.
How to Buy Oil Stocks
How do I invest in oil stocks?
Oil stocks can be purchased through standard brokerage accounts, retirement accounts, or dividend-focused portfolios. Investors should consider position sizing due to sector volatility.
What is the easiest way to get exposure to oil?
Energy ETFs or integrated oil majors offer simple exposure without the complexity of futures or leveraged products.
Should I buy oil stocks or trade crude oil futures?
Oil stocks are better suited for long-term investors, while crude futures are primarily for short-term traders and hedgers due to leverage and roll costs.
Oil Stocks Investment Strategy
How often should I rebalance an oil-focused portfolio?
Annual or semiannual rebalancing is typically sufficient unless oil prices experience extreme volatility.
When should I sell oil stocks?
Common sell signals include deteriorating balance sheets, dividend cuts, excessive capital spending, or valuations that exceed historical norms.
What are the tax implications of holding or selling oil stocks?
Dividends are generally taxable, while capital gains depend on holding period. Master limited partnerships (MLPs) may involve more complex tax reporting.
Alternatives to Oil Stocks
Should I invest in renewable energy stocks instead?
Renewable energy stocks offer growth potential but often lack the cash flow stability of oil majors. A blended energy portfolio can balance income and growth.
What are the safest alternatives to oil stocks?
Energy infrastructure companies, utilities, and diversified energy ETFs are typically less volatile alternatives for conservative investors.
Bottom Line
The best oil stocks in 2026 are not defined by aggressive production growth but by capital discipline, resilient cash flow, and shareholder returns. Investors who understand the cyclical nature of oil and focus on quality businesses can still find oil stocks to be a valuable part of a diversified portfolio.


 Strong Buy