We use cookies to understand how you use our site and to improve your experience.
This includes personalizing content and advertising.
By pressing "Accept All" or closing out of this banner, you consent to the use of all cookies and similar technologies and the sharing of information they collect with third parties.
You can reject marketing cookies by pressing "Deny Optional," but we still use essential, performance, and functional cookies.
In addition, whether you "Accept All," Deny Optional," click the X or otherwise continue to use the site, you accept our Privacy Policy and Terms of Service, revised from time to time.
You are being directed to ZacksTrade, a division of LBMZ Securities and licensed broker-dealer. ZacksTrade and Zacks.com are separate companies. The web link between the two companies is not a solicitation or offer to invest in a particular security or type of security. ZacksTrade does not endorse or adopt any particular investment strategy, any analyst opinion/rating/report or any approach to evaluating individual securities.
If you wish to go to ZacksTrade, click OK. If you do not, click Cancel.
The utilities sector includes electric, gas, and water providers that operate in regulated markets.
As utility stocks offer predictable revenue, they are seen as defensive holdings in a diversified portfolio.
Top utility stocks to buy now include MYR Group, Telefônica Brasil, and Otter Tail.
Utility stocks have long served as a cornerstone for conservative investors seeking income, relative stability, and downside protection. In periods of economic uncertainty, their regulated business models and consistent cash flows tend to stand out. Now, as interest rate expectations evolve and electricity demand accelerates from AI data centers, broader electrification, and renewable energy expansion, the sector is drawing renewed attention in 2026.
Below is a comprehensive guide to the best utility stocks, highlighting high performers, leading dividend payers, potentially undervalued opportunities, and companies with durable long term compounding potential.
Utility Stock Market Overview and Forecast
The utilities sector includes electric, gas, and water providers that operate in regulated markets. Because these companies generate predictable revenue streams, they are often seen as defensive holdings within a diversified portfolio.
In 2026, several forces are shaping the sector:
Rising electricity demand from data centers and AI infrastructure.
Grid modernization and renewable energy investments.
Interest-rate stabilization after prior tightening cycles.
Increased focus on ESG and decarbonization initiatives.
Utilities have historically outperformed during volatile or slowing markets, though they can lag in strong bull runs when investors favor higher growth sectors. Even so, improving earnings outlooks and capital investment plans are helping narrow that performance gap.
Is Now a Good Time to Invest in Utility Stocks?
Many analysts suggest utilities may benefit if interest rates stabilize or decline. Lower borrowing costs can improve margins because utilities rely heavily on debt financing for infrastructure projects. Meanwhile, steady dividend yields — often ranging between 3% and 6% — remain attractive compared to broader market averages.
Below, we examine and rank leading utility stocks using a blend of Zacks Rank signals, Style Scores, and core fundamental metrics to identify companies that may offer compelling long term opportunities for patient investors.
This is our short term rating system that serves as a timeliness indicator for stocks over the next 1 to 3 months. How good is it? See rankings and related performance below.
The Zacks Industry Rank assigns a rating to each of the 265 X (Expanded) Industries based on their average Zacks Rank.
An industry with a larger percentage of Zacks Rank #1's and #2's will have a better average Zacks Rank than one with a larger percentage of Zacks Rank #4's and #5's.
The industry with the best average Zacks Rank would be considered the top industry (1 out of 265), which would place it in the top 1% of Zacks Ranked Industries. The industry with the worst average Zacks Rank (265 out of 265) would place in the bottom 1%.
The Zacks Sector Rank assigns a rating to each of the 16 Sectors based on their average Zacks Rank.
A sector with a larger percentage of Zacks Rank #1's and #2's will have a better average Zacks Rank than one with a larger percentage of Zacks Rank #4's and #5's.
The sector with the best average Zacks Rank would be considered the top sector (1 out of 16), which would place it in the top 1% of Zacks Ranked Sectors. The sector with the worst average Zacks Rank (16 out of 16) would place in the bottom 1%.
The Style Scores are a complementary set of indicators to use alongside the Zacks Rank. It allows the user to better focus on the stocks that are the best fit for his or her personal trading style.
The scores are based on the trading styles of Value, Growth, and Momentum. There's also a VGM Score ('V' for Value, 'G' for Growth and 'M' for Momentum), which combines the weighted average of the individual style scores into one score.
Value ScoreA
Growth ScoreA
Momentum ScoreA
VGM ScoreA
Within each Score, stocks are graded into five groups: A, B, C, D and F. As you might remember from your school days, an A, is better than a B; a B is better than a C; a C is better than a D; and a D is better than an F.
As an investor, you want to buy stocks with the highest probability of success. That means you want to buy stocks with a Zacks Rank #1 or #2, Strong Buy or Buy, which also has a Score of an A or a B in your personal trading style.
Zacks Earnings ESP (Expected Surprise Prediction) looks to find companies that have recently seen positive earnings estimate revision activity. The idea is that more recent information is, generally speaking, more accurate and can be a better predictor of the future, which can give investors an advantage in earnings season.
The technique has proven to be very useful for finding positive surprises. In fact, when combining a Zacks Rank #3 or better and a positive Earnings ESP, stocks produced a positive surprise 70% of the time, while they also saw 28.3% annual returns on average, according to our 10 year backtest.
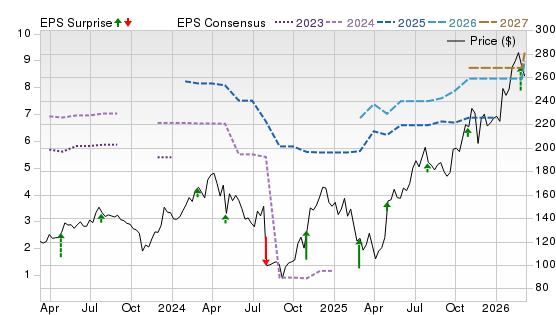
MYR Group is a specialty contractor to electric utilities, focused on transmission, distribution, and substation work that supports grid reliability and expansion. In Q1 2026, management highlighted solid end-market demand and delivered record profitability, supported by strong operational execution and a healthy backlog that improves visibility. Its scale, specialized craft labor, and partnerships with major utilities position it to win more higher-value projects.
Potential Risks
Results can swing with weather, labor tightness, change-order timing, and missteps on large contracts. A pullback in utility capital budgets, slower permitting, or customer schedule resets would hit utilization and margins, and the shares can react sharply.
Forecast
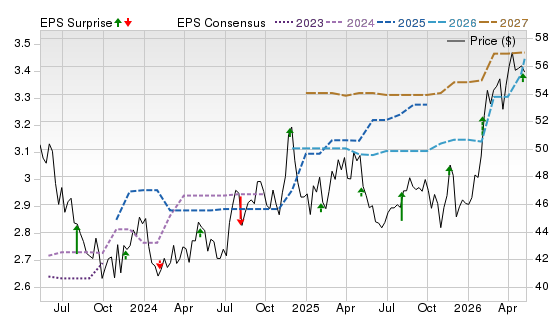
A Zacks Rank #1 (Strong Buy) signals favorable estimate revisions, while Scores of A for Growth and Momentum show fundamentals and price action are aligned despite a Value of D. The Price, Consensus & EPS Surprise chart shows the 2026–2027 EPS consensus trending higher and mostly positive earnings surprises.
This is our short term rating system that serves as a timeliness indicator for stocks over the next 1 to 3 months. How good is it? See rankings and related performance below.
The Zacks Industry Rank assigns a rating to each of the 265 X (Expanded) Industries based on their average Zacks Rank.
An industry with a larger percentage of Zacks Rank #1's and #2's will have a better average Zacks Rank than one with a larger percentage of Zacks Rank #4's and #5's.
The industry with the best average Zacks Rank would be considered the top industry (1 out of 265), which would place it in the top 1% of Zacks Ranked Industries. The industry with the worst average Zacks Rank (265 out of 265) would place in the bottom 1%.
The Zacks Sector Rank assigns a rating to each of the 16 Sectors based on their average Zacks Rank.
A sector with a larger percentage of Zacks Rank #1's and #2's will have a better average Zacks Rank than one with a larger percentage of Zacks Rank #4's and #5's.
The sector with the best average Zacks Rank would be considered the top sector (1 out of 16), which would place it in the top 1% of Zacks Ranked Sectors. The sector with the worst average Zacks Rank (16 out of 16) would place in the bottom 1%.
The Style Scores are a complementary set of indicators to use alongside the Zacks Rank. It allows the user to better focus on the stocks that are the best fit for his or her personal trading style.
The scores are based on the trading styles of Value, Growth, and Momentum. There's also a VGM Score ('V' for Value, 'G' for Growth and 'M' for Momentum), which combines the weighted average of the individual style scores into one score.
Value ScoreA
Growth ScoreA
Momentum ScoreA
VGM ScoreA
Within each Score, stocks are graded into five groups: A, B, C, D and F. As you might remember from your school days, an A, is better than a B; a B is better than a C; a C is better than a D; and a D is better than an F.
As an investor, you want to buy stocks with the highest probability of success. That means you want to buy stocks with a Zacks Rank #1 or #2, Strong Buy or Buy, which also has a Score of an A or a B in your personal trading style.
Zacks Earnings ESP (Expected Surprise Prediction) looks to find companies that have recently seen positive earnings estimate revision activity. The idea is that more recent information is, generally speaking, more accurate and can be a better predictor of the future, which can give investors an advantage in earnings season.
The technique has proven to be very useful for finding positive surprises. In fact, when combining a Zacks Rank #3 or better and a positive Earnings ESP, stocks produced a positive surprise 70% of the time, while they also saw 28.3% annual returns on average, according to our 10 year backtest.
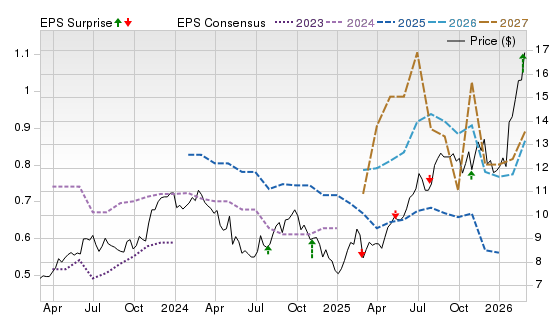
Otter Tail runs a regulated Upper Midwest electric utility and also owns manufacturing and plastics businesses. In Q1 2026, EPS improved, and management reaffirmed its 2026 guidance range, signaling solid utility fundamentals and strength across segments. The company’s focus on rate-based growth in the utility sector, planned capital investments, and progress in Minnesota and South Dakota proceedings can keep earnings compounding, while wind repowering and solar development projects add longer-duration visibility.
Potential Risks
Manufacturing and plastics can swing with industrial demand and pricing, adding volatility that pure-play utilities avoid. Regulatory outcomes and higher interest expense could pressure results if the rate path or capital timing slips.
Forecast
A Zacks Rank #1 indicates positive estimate revisions, but Scores of D for Value, F for Growth, and D for Momentum flag limited factor support. The company’s chart shows the 2026 consensus edging up, while 2027 looks more restrained, with a choppy price trend.
This is our short term rating system that serves as a timeliness indicator for stocks over the next 1 to 3 months. How good is it? See rankings and related performance below.
The Zacks Industry Rank assigns a rating to each of the 265 X (Expanded) Industries based on their average Zacks Rank.
An industry with a larger percentage of Zacks Rank #1's and #2's will have a better average Zacks Rank than one with a larger percentage of Zacks Rank #4's and #5's.
The industry with the best average Zacks Rank would be considered the top industry (1 out of 265), which would place it in the top 1% of Zacks Ranked Industries. The industry with the worst average Zacks Rank (265 out of 265) would place in the bottom 1%.
The Zacks Sector Rank assigns a rating to each of the 16 Sectors based on their average Zacks Rank.
A sector with a larger percentage of Zacks Rank #1's and #2's will have a better average Zacks Rank than one with a larger percentage of Zacks Rank #4's and #5's.
The sector with the best average Zacks Rank would be considered the top sector (1 out of 16), which would place it in the top 1% of Zacks Ranked Sectors. The sector with the worst average Zacks Rank (16 out of 16) would place in the bottom 1%.
The Style Scores are a complementary set of indicators to use alongside the Zacks Rank. It allows the user to better focus on the stocks that are the best fit for his or her personal trading style.
The scores are based on the trading styles of Value, Growth, and Momentum. There's also a VGM Score ('V' for Value, 'G' for Growth and 'M' for Momentum), which combines the weighted average of the individual style scores into one score.
Value ScoreA
Growth ScoreA
Momentum ScoreA
VGM ScoreA
Within each Score, stocks are graded into five groups: A, B, C, D and F. As you might remember from your school days, an A, is better than a B; a B is better than a C; a C is better than a D; and a D is better than an F.
As an investor, you want to buy stocks with the highest probability of success. That means you want to buy stocks with a Zacks Rank #1 or #2, Strong Buy or Buy, which also has a Score of an A or a B in your personal trading style.
Zacks Earnings ESP (Expected Surprise Prediction) looks to find companies that have recently seen positive earnings estimate revision activity. The idea is that more recent information is, generally speaking, more accurate and can be a better predictor of the future, which can give investors an advantage in earnings season.
The technique has proven to be very useful for finding positive surprises. In fact, when combining a Zacks Rank #3 or better and a positive Earnings ESP, stocks produced a positive surprise 70% of the time, while they also saw 28.3% annual returns on average, according to our 10 year backtest.
Telefônica Brasil is Brazil’s leading telecom operator, a utility-like connectivity franchise with recurring service revenue. The company’s large postpaid base, deep fiber footprint, and extensive 4G/5G coverage support relatively resilient demand and pricing power compared with smaller rivals. Its strong cash generation capabilities support dividends and buybacks while still funding spectrum, fiber, and 5G investment.
Potential Risks
Brazil adds currency and macro risk, and intense competition can force promotions that erode margins. Large network capex cycles and spectrum costs can pressure free cash flow, while regulatory shifts or taxation changes can alter returns and dividend capacity.
Forecast
A Zacks Rank #2 (Buy) with Scores of B for Value and Growth, and C for Momentum points to healthy revision momentum. The chart shows 2026–2027 EPS estimates have firmed amid a mixed surprise pattern, suggesting steady progress but uneven quarterly expectations.
This is our short term rating system that serves as a timeliness indicator for stocks over the next 1 to 3 months. How good is it? See rankings and related performance below.
The Zacks Industry Rank assigns a rating to each of the 265 X (Expanded) Industries based on their average Zacks Rank.
An industry with a larger percentage of Zacks Rank #1's and #2's will have a better average Zacks Rank than one with a larger percentage of Zacks Rank #4's and #5's.
The industry with the best average Zacks Rank would be considered the top industry (1 out of 265), which would place it in the top 1% of Zacks Ranked Industries. The industry with the worst average Zacks Rank (265 out of 265) would place in the bottom 1%.
The Zacks Sector Rank assigns a rating to each of the 16 Sectors based on their average Zacks Rank.
A sector with a larger percentage of Zacks Rank #1's and #2's will have a better average Zacks Rank than one with a larger percentage of Zacks Rank #4's and #5's.
The sector with the best average Zacks Rank would be considered the top sector (1 out of 16), which would place it in the top 1% of Zacks Ranked Sectors. The sector with the worst average Zacks Rank (16 out of 16) would place in the bottom 1%.
The Style Scores are a complementary set of indicators to use alongside the Zacks Rank. It allows the user to better focus on the stocks that are the best fit for his or her personal trading style.
The scores are based on the trading styles of Value, Growth, and Momentum. There's also a VGM Score ('V' for Value, 'G' for Growth and 'M' for Momentum), which combines the weighted average of the individual style scores into one score.
Value ScoreA
Growth ScoreA
Momentum ScoreA
VGM ScoreA
Within each Score, stocks are graded into five groups: A, B, C, D and F. As you might remember from your school days, an A, is better than a B; a B is better than a C; a C is better than a D; and a D is better than an F.
As an investor, you want to buy stocks with the highest probability of success. That means you want to buy stocks with a Zacks Rank #1 or #2, Strong Buy or Buy, which also has a Score of an A or a B in your personal trading style.
Zacks Earnings ESP (Expected Surprise Prediction) looks to find companies that have recently seen positive earnings estimate revision activity. The idea is that more recent information is, generally speaking, more accurate and can be a better predictor of the future, which can give investors an advantage in earnings season.
The technique has proven to be very useful for finding positive surprises. In fact, when combining a Zacks Rank #3 or better and a positive Earnings ESP, stocks produced a positive surprise 70% of the time, while they also saw 28.3% annual returns on average, according to our 10 year backtest.
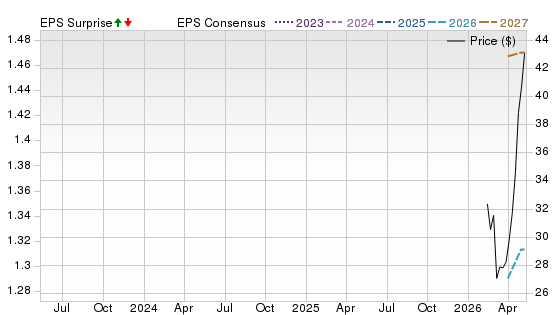
SOLV Energy provides construction, engineering, operations, and maintenance (O&M) services for utility-scale solar and storage projects, tying results to power-sector buildouts. In Q4 2025, the newly public company posted rapid year-over-year growth and highlighted a larger backlog, underscoring demand for grid-scale renewables and lifecycle services.
Potential Risks
As results are project-driven, contract timing, supply-chain hiccups, and operational execution issues can swing margins. As a newer public company, SOLV faces integration risk, customer concentration, and sensitivity to policy or interconnection delays that slow deployments.
Forecast
A Zacks Rank #2 with Scores of C for Value and Growth, and D for Momentum suggests a neutral setup. The company’s chart has a limited history, with 2026 EPS consensus edging higher alongside a volatile post-IPO price move, so upcoming quarters will steer the consensus path.
This is our short term rating system that serves as a timeliness indicator for stocks over the next 1 to 3 months. How good is it? See rankings and related performance below.
The Zacks Industry Rank assigns a rating to each of the 265 X (Expanded) Industries based on their average Zacks Rank.
An industry with a larger percentage of Zacks Rank #1's and #2's will have a better average Zacks Rank than one with a larger percentage of Zacks Rank #4's and #5's.
The industry with the best average Zacks Rank would be considered the top industry (1 out of 265), which would place it in the top 1% of Zacks Ranked Industries. The industry with the worst average Zacks Rank (265 out of 265) would place in the bottom 1%.
The Zacks Sector Rank assigns a rating to each of the 16 Sectors based on their average Zacks Rank.
A sector with a larger percentage of Zacks Rank #1's and #2's will have a better average Zacks Rank than one with a larger percentage of Zacks Rank #4's and #5's.
The sector with the best average Zacks Rank would be considered the top sector (1 out of 16), which would place it in the top 1% of Zacks Ranked Sectors. The sector with the worst average Zacks Rank (16 out of 16) would place in the bottom 1%.
The Style Scores are a complementary set of indicators to use alongside the Zacks Rank. It allows the user to better focus on the stocks that are the best fit for his or her personal trading style.
The scores are based on the trading styles of Value, Growth, and Momentum. There's also a VGM Score ('V' for Value, 'G' for Growth and 'M' for Momentum), which combines the weighted average of the individual style scores into one score.
Value ScoreA
Growth ScoreA
Momentum ScoreA
VGM ScoreA
Within each Score, stocks are graded into five groups: A, B, C, D and F. As you might remember from your school days, an A, is better than a B; a B is better than a C; a C is better than a D; and a D is better than an F.
As an investor, you want to buy stocks with the highest probability of success. That means you want to buy stocks with a Zacks Rank #1 or #2, Strong Buy or Buy, which also has a Score of an A or a B in your personal trading style.
Zacks Earnings ESP (Expected Surprise Prediction) looks to find companies that have recently seen positive earnings estimate revision activity. The idea is that more recent information is, generally speaking, more accurate and can be a better predictor of the future, which can give investors an advantage in earnings season.
The technique has proven to be very useful for finding positive surprises. In fact, when combining a Zacks Rank #3 or better and a positive Earnings ESP, stocks produced a positive surprise 70% of the time, while they also saw 28.3% annual returns on average, according to our 10 year backtest.
New Jersey Resources is a regulated natural-gas utility with complementary midstream, energy services, and solar investments. In Q2 fiscal 2026, the company delivered earnings growth and raised net financial earnings guidance, with solid momentum in its Energy Services and Natural Gas Distribution businesses.
Potential Risks
A warmer winter or calmer commodity markets can compress Energy Services margins, making results less predictable than a pure regulated utility. Regulatory lag, rate-case outcomes, and the cost of capital for clean-energy projects could pressure returns if financing stays tight.
Forecast
Zacks Rank #2 reflects favorable revisions, and Scores of A for Growth and Momentum, and B for Value suggest a supportive setup. The company’s chart shows EPS estimates stair-stepping higher into 2026–2027 alongside a steadier price uptrend; recent earnings surprises tilt positive after earlier variability.
The Zacks Rank is a proprietary stock-rating model that uses trends in earnings estimate revisions and earnings-per-share (EPS) surprises to classify stocks into five groups: #1 (Strong Buy), #2 (Buy), #3 (Hold), #4 (Sell) and #5 (Strong Sell). The Zacks Rank is calculated through four primary factors related to earnings estimates: analysts' consensus on earnings estimate revisions, the magnitude of revision change, the upside potential and estimate surprise (or the degree in which earnings per share deviated from the previous quarter).
Zacks builds the data from 3,000 analysts at over 150 different brokerage firms. The average yearly gain for Zacks Rank #1 (Strong Buy) stocks is +23.62% per year from January, 1988, through June 2, 2025.
Selections for Best Utility Stocks are based on the current top ranking stocks based on Zacks Indicator Score, Style Scores and fundamentals. All stocks have a daily trading volume of at least 100,000 shares and have a stock price of at least $5. All information is current as of market open, May 11, 2026.
Guide to Best Utility Stocks: What Are Utility Stocks?
Utility stocks represent companies that provide essential services like electricity, natural gas, and water to residential and commercial customers.
How Do Utility Stocks Work?
Most utilities operate as regulated monopolies within defined geographic areas. State regulators set allowable rates of return, creating predictable revenue streams in exchange for infrastructure investment.
Why Do People Invest in Utility Stocks?
Reliable dividend income.
Lower volatility relative to growth stocks.
Defensive performance during economic slowdowns.
How Often Do Utility Stocks Pay Dividends in a Year?
Most U.S. utility companies pay dividends quarterly (four times per year).
Pros of Utility Stocks
Stable cash flow.
Recession resilience.
Attractive dividend yields.
Essential-service demand.
Cons of Utility Stocks
Interest-rate sensitivity.
Heavy capital expenditure needs.
Regulatory risk.
Slower growth compared to tech sectors.
Utility ETFs vs Utility Stocks
Investors can choose individual stocks or diversified ETFs.
Best Utility ETFs
Utilities Select Sector SPDR Fund (XLU)
Vanguard Utilities ETF (VPU)
iShares U.S. Utilities ETF (IDU)
ETFs offer instant diversification, while individual stocks may provide higher upside potential.
How to Choose the Best Utility Stocks
Consider:
Dividend yield and payout ratio.
Earnings and revenue consistency.
Regulatory environment strength.
Debt levels and credit ratings.
Renewable transition strategy.
Long-term infrastructure growth plans.
What Are the Utility Stocks That Are Good Investments?
Electric: Duke Energy (DUK), NextEra Energy (NEE). Water: American Water Works (AWK). Gas: Atmos Energy (ATO). ESG-friendly: Xcel Energy (XEL), NextEra Energy (NEE).
How to Buy Utility Stocks
Open a brokerage account.
Research financials and dividend history.
Decide between individual stocks or ETFs.
Monitor regulatory developments and earnings reports.
Tips for Building a Utility Portfolio
Blend high-yield and growth utilities.
Diversify across electric, gas, and water.
Include at least one ETF for balance.
Reinvest dividends for compounding.
Frequently Asked Questions About Utility Stocks
How Are Utility Dividends Taxed?
Most are qualified dividends taxed at long-term capital gains rates, though investors should verify individual tax situations.
Are Utility Stocks Safe During Recessions?
Historically, utilities have outperformed the broader market during downturns because demand for electricity and water remains steady.
What’s a Good Dividend Yield for Utility Stocks?
According to industry rankings from research firms like Zacks, many electric utilities historically yield between 3% and 5%, higher than the broader S&P 500 average.
Are Utility Stocks Safe for Beginners?
Yes, they are often considered beginner-friendly due to predictable earnings and dividends.
Are Utility Stocks Good for Passive Income?
They are widely used in income-focused portfolios because of consistent quarterly payouts.
How Do Utility Stocks Perform During Market Downturns?
They typically decline less than high-growth sectors but may still experience volatility during severe selloffs.
Is Now a Good Time to Invest in Utility Stocks?
With rising electricity demand and potential interest-rate stabilization, 2025 presents favorable conditions for selective utility investments.
How Do Rising Interest Rates Affect Utility Stocks?
Higher rates can pressure valuations because utilities rely heavily on debt and compete with bond yields for income-focused investors.
Bottom Line
The best utility stocks in March 2025 combine reliable dividends, manageable debt, constructive regulatory environments, and exposure to long-term electrification trends. Whether you prioritize income, growth, or retirement stability, utilities remain a foundational sector for diversified portfolios.


 Strong Buy
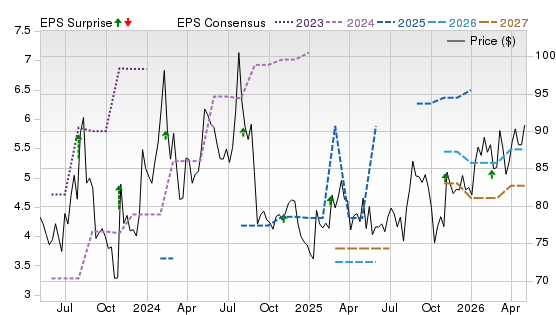


 Stocks to Buy Now May 2026")