We use cookies to understand how you use our site and to improve your experience.
This includes personalizing content and advertising.
By pressing "Accept All" or closing out of this banner, you consent to the use of all cookies and similar technologies and the sharing of information they collect with third parties.
You can reject marketing cookies by pressing "Deny Optional," but we still use essential, performance, and functional cookies.
In addition, whether you "Accept All," Deny Optional," click the X or otherwise continue to use the site, you accept our Privacy Policy and Terms of Service, revised from time to time.
You are being directed to ZacksTrade, a division of LBMZ Securities and licensed broker-dealer. ZacksTrade and Zacks.com are separate companies. The web link between the two companies is not a solicitation or offer to invest in a particular security or type of security. ZacksTrade does not endorse or adopt any particular investment strategy, any analyst opinion/rating/report or any approach to evaluating individual securities.
If you wish to go to ZacksTrade, click OK. If you do not, click Cancel.
A growing number of publicly traded companies are closely tied to the cryptocurrency ecosystem.
When Bitcoin rallies, crypto-linked companies often move even more sharply because their business models.
Among the top crypto stocks to buy now include Flywire, Figure Technology and Klarna Group.
Investors seeking exposure to digital assets do not necessarily have to buy cryptocurrencies like Bitcoin or Ethereum directly. A growing number of publicly traded companies are closely tied to the cryptocurrency ecosystem, including exchanges, mining operations, software providers, and payment platforms that facilitate blockchain transactions.
This guide examines some of the most prominent crypto-related stocks, how their businesses connect to digital asset markets, the risks investors should understand, and how owning these equities compares with holding cryptocurrencies themselves.
Is Now a Good Time to Invest in Crypto Stocks?
Timing crypto stocks often depends on three major forces:
Bitcoin price momentum.
Regulatory clarity.
Institutional adoption (including ETFs).
When Bitcoin rallies, crypto-linked companies often move even more sharply because their business models provide operational leverage. Mining companies such as Marathon Digital Holdings (MARA) and Riot Platforms (RIOT), for instance, can see profits expand quickly when mining revenue rises while many operating costs remain relatively stable.
The same dynamic works in reverse during downturns. Crypto stocks frequently decline more sharply than Bitcoin itself, which means investors should expect significant volatility.
For long-term investors, periods of weakness in the cryptocurrency market may present opportunities. Valuations for crypto-related companies can compress during bear markets even as broader blockchain adoption continues to expand across financial services, technology infrastructure, and digital payments.
Below, we examine and rank leading crypto stocks using a blend of Zacks Rank signals, Style Scores, and core fundamental metrics to identify companies that may offer compelling long-term opportunities for patient investors.
This is our short term rating system that serves as a timeliness indicator for stocks over the next 1 to 3 months. How good is it? See rankings and related performance below.
The Zacks Industry Rank assigns a rating to each of the 265 X (Expanded) Industries based on their average Zacks Rank.
An industry with a larger percentage of Zacks Rank #1's and #2's will have a better average Zacks Rank than one with a larger percentage of Zacks Rank #4's and #5's.
The industry with the best average Zacks Rank would be considered the top industry (1 out of 265), which would place it in the top 1% of Zacks Ranked Industries. The industry with the worst average Zacks Rank (265 out of 265) would place in the bottom 1%.
The Zacks Sector Rank assigns a rating to each of the 16 Sectors based on their average Zacks Rank.
A sector with a larger percentage of Zacks Rank #1's and #2's will have a better average Zacks Rank than one with a larger percentage of Zacks Rank #4's and #5's.
The sector with the best average Zacks Rank would be considered the top sector (1 out of 16), which would place it in the top 1% of Zacks Ranked Sectors. The sector with the worst average Zacks Rank (16 out of 16) would place in the bottom 1%.
The Style Scores are a complementary set of indicators to use alongside the Zacks Rank. It allows the user to better focus on the stocks that are the best fit for his or her personal trading style.
The scores are based on the trading styles of Value, Growth, and Momentum. There's also a VGM Score ('V' for Value, 'G' for Growth and 'M' for Momentum), which combines the weighted average of the individual style scores into one score.
Value ScoreA
Growth ScoreA
Momentum ScoreA
VGM ScoreA
Within each Score, stocks are graded into five groups: A, B, C, D and F. As you might remember from your school days, an A, is better than a B; a B is better than a C; a C is better than a D; and a D is better than an F.
As an investor, you want to buy stocks with the highest probability of success. That means you want to buy stocks with a Zacks Rank #1 or #2, Strong Buy or Buy, which also has a Score of an A or a B in your personal trading style.
Zacks Earnings ESP (Expected Surprise Prediction) looks to find companies that have recently seen positive earnings estimate revision activity. The idea is that more recent information is, generally speaking, more accurate and can be a better predictor of the future, which can give investors an advantage in earnings season.
The technique has proven to be very useful for finding positive surprises. In fact, when combining a Zacks Rank #3 or better and a positive Earnings ESP, stocks produced a positive surprise 70% of the time, while they also saw 28.3% annual returns on average, according to our 10 year backtest.
Flywire runs a vertical-focused, cross-border payments platform and is adding crypto-adjacent rails by accepting USDC and USDT stablecoin payments in select corridors. The latest quarter showed stronger execution, with results above expectations, a raised 2026 outlook, and a $50 million accelerated share repurchase. Deeper integrations, such as Workday Student, can automate billing and reconciliation for schools, supporting share gains as international flows recover.
Potential Risks
Cross-border flows are exposed to FX and policy shifts, and heavier compliance or slower client wins could stall margin progress. The stock is also sensitive to risk-off fintech reratings.
Forecast
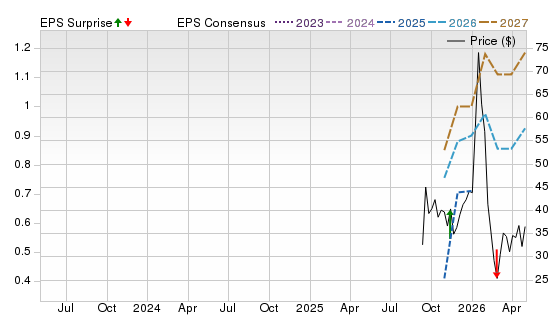
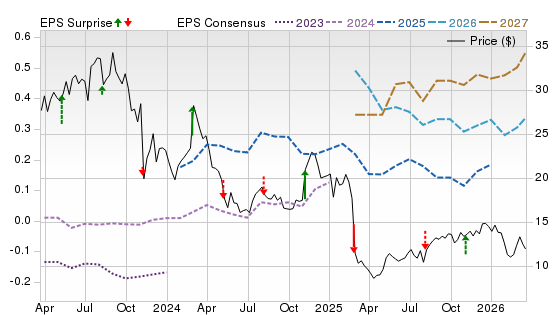
A Zacks Rank #2 (Buy) with a Style Score of A for Growth and B for Momentum points to favorable estimate and price trends despite a C Value Score. The Price, Consensus & EPS Surprise chart shows 2026-2027 EPS estimates drifting higher after mixed surprises, and the price trend is forming a base after the 2025 drawdown, so steadier beats matter.
This is our short term rating system that serves as a timeliness indicator for stocks over the next 1 to 3 months. How good is it? See rankings and related performance below.
The Zacks Industry Rank assigns a rating to each of the 265 X (Expanded) Industries based on their average Zacks Rank.
An industry with a larger percentage of Zacks Rank #1's and #2's will have a better average Zacks Rank than one with a larger percentage of Zacks Rank #4's and #5's.
The industry with the best average Zacks Rank would be considered the top industry (1 out of 265), which would place it in the top 1% of Zacks Ranked Industries. The industry with the worst average Zacks Rank (265 out of 265) would place in the bottom 1%.
The Zacks Sector Rank assigns a rating to each of the 16 Sectors based on their average Zacks Rank.
A sector with a larger percentage of Zacks Rank #1's and #2's will have a better average Zacks Rank than one with a larger percentage of Zacks Rank #4's and #5's.
The sector with the best average Zacks Rank would be considered the top sector (1 out of 16), which would place it in the top 1% of Zacks Ranked Sectors. The sector with the worst average Zacks Rank (16 out of 16) would place in the bottom 1%.
The Style Scores are a complementary set of indicators to use alongside the Zacks Rank. It allows the user to better focus on the stocks that are the best fit for his or her personal trading style.
The scores are based on the trading styles of Value, Growth, and Momentum. There's also a VGM Score ('V' for Value, 'G' for Growth and 'M' for Momentum), which combines the weighted average of the individual style scores into one score.
Value ScoreA
Growth ScoreA
Momentum ScoreA
VGM ScoreA
Within each Score, stocks are graded into five groups: A, B, C, D and F. As you might remember from your school days, an A, is better than a B; a B is better than a C; a C is better than a D; and a D is better than an F.
As an investor, you want to buy stocks with the highest probability of success. That means you want to buy stocks with a Zacks Rank #1 or #2, Strong Buy or Buy, which also has a Score of an A or a B in your personal trading style.
Zacks Earnings ESP (Expected Surprise Prediction) looks to find companies that have recently seen positive earnings estimate revision activity. The idea is that more recent information is, generally speaking, more accurate and can be a better predictor of the future, which can give investors an advantage in earnings season.
The technique has proven to be very useful for finding positive surprises. In fact, when combining a Zacks Rank #3 or better and a positive Earnings ESP, stocks produced a positive surprise 70% of the time, while they also saw 28.3% annual returns on average, according to our 10 year backtest.
Figure Technology Solutions is a blockchain-native capital marketplace with crypto exposure via tokenized assets and its SEC-registered yield-bearing stablecoin, $YLDS. The latest quarter delivered rapid net-revenue growth, strong adjusted EBITDA, and record consumer-loan marketplace volume, signaling scalable economics when partners route flow to its platform. Continued adoption of Figure Connect could lift recurring transaction and marketplace fees with relatively light incremental cost.
Potential Risks
Credit tightening or weaker loan demand could slow marketplace activity. The regulatory backdrop for tokenization and stablecoins is fluid, and the stock’s swings show sentiment can reverse fast.
Forecast
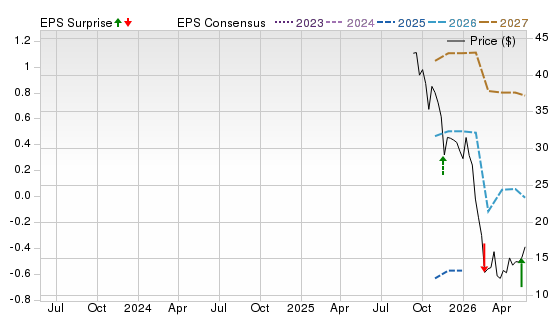
Zacks Rank #2 and Momentum A are constructive, but the Growth Score of D argues for monitoring estimate momentum. The chart shows a 2026 spike-and-drop after a negative surprise, while the 2026-2027 EPS consensus recovers higher, so upside likely depends on steadier beats and upward revisions.
This is our short term rating system that serves as a timeliness indicator for stocks over the next 1 to 3 months. How good is it? See rankings and related performance below.
The Zacks Industry Rank assigns a rating to each of the 265 X (Expanded) Industries based on their average Zacks Rank.
An industry with a larger percentage of Zacks Rank #1's and #2's will have a better average Zacks Rank than one with a larger percentage of Zacks Rank #4's and #5's.
The industry with the best average Zacks Rank would be considered the top industry (1 out of 265), which would place it in the top 1% of Zacks Ranked Industries. The industry with the worst average Zacks Rank (265 out of 265) would place in the bottom 1%.
The Zacks Sector Rank assigns a rating to each of the 16 Sectors based on their average Zacks Rank.
A sector with a larger percentage of Zacks Rank #1's and #2's will have a better average Zacks Rank than one with a larger percentage of Zacks Rank #4's and #5's.
The sector with the best average Zacks Rank would be considered the top sector (1 out of 16), which would place it in the top 1% of Zacks Ranked Sectors. The sector with the worst average Zacks Rank (16 out of 16) would place in the bottom 1%.
The Style Scores are a complementary set of indicators to use alongside the Zacks Rank. It allows the user to better focus on the stocks that are the best fit for his or her personal trading style.
The scores are based on the trading styles of Value, Growth, and Momentum. There's also a VGM Score ('V' for Value, 'G' for Growth and 'M' for Momentum), which combines the weighted average of the individual style scores into one score.
Value ScoreA
Growth ScoreA
Momentum ScoreA
VGM ScoreA
Within each Score, stocks are graded into five groups: A, B, C, D and F. As you might remember from your school days, an A, is better than a B; a B is better than a C; a C is better than a D; and a D is better than an F.
As an investor, you want to buy stocks with the highest probability of success. That means you want to buy stocks with a Zacks Rank #1 or #2, Strong Buy or Buy, which also has a Score of an A or a B in your personal trading style.
Zacks Earnings ESP (Expected Surprise Prediction) looks to find companies that have recently seen positive earnings estimate revision activity. The idea is that more recent information is, generally speaking, more accurate and can be a better predictor of the future, which can give investors an advantage in earnings season.
The technique has proven to be very useful for finding positive surprises. In fact, when combining a Zacks Rank #3 or better and a positive Earnings ESP, stocks produced a positive surprise 70% of the time, while they also saw 28.3% annual returns on average, according to our 10 year backtest.
Klarna is a BNPL and digital-banking platform, and its KlarnaUSD stablecoin effort targets cheaper cross-border transfers, giving investors crypto-adjacent optionality. Business trends improved into 2026, Q1 revenue reached $1 billion, and adjusted operating profit jumped, while active users and the Klarna Card base expanded, widening the franchise beyond checkout. A shift toward a broader banking suite, including debit and lending, could deepen engagement as stablecoins gain utility.
Potential Risks
Credit costs can spike in a downturn, and regulators can tighten rules around consumer lending and fees. Crypto initiatives add compliance and execution risk.
Forecast
Zacks Rank #2 is supportive, but the F Value and Growth scores and C Momentum argue for patience. The chart shows 2026-2027 EPS consensus trending lower with uneven surprises, and price only partially rebounding from a sharp break, implying upside depends on stabilizing estimates and cleaner beats.
This is our short term rating system that serves as a timeliness indicator for stocks over the next 1 to 3 months. How good is it? See rankings and related performance below.
The Zacks Industry Rank assigns a rating to each of the 265 X (Expanded) Industries based on their average Zacks Rank.
An industry with a larger percentage of Zacks Rank #1's and #2's will have a better average Zacks Rank than one with a larger percentage of Zacks Rank #4's and #5's.
The industry with the best average Zacks Rank would be considered the top industry (1 out of 265), which would place it in the top 1% of Zacks Ranked Industries. The industry with the worst average Zacks Rank (265 out of 265) would place in the bottom 1%.
The Zacks Sector Rank assigns a rating to each of the 16 Sectors based on their average Zacks Rank.
A sector with a larger percentage of Zacks Rank #1's and #2's will have a better average Zacks Rank than one with a larger percentage of Zacks Rank #4's and #5's.
The sector with the best average Zacks Rank would be considered the top sector (1 out of 16), which would place it in the top 1% of Zacks Ranked Sectors. The sector with the worst average Zacks Rank (16 out of 16) would place in the bottom 1%.
The Style Scores are a complementary set of indicators to use alongside the Zacks Rank. It allows the user to better focus on the stocks that are the best fit for his or her personal trading style.
The scores are based on the trading styles of Value, Growth, and Momentum. There's also a VGM Score ('V' for Value, 'G' for Growth and 'M' for Momentum), which combines the weighted average of the individual style scores into one score.
Value ScoreA
Growth ScoreA
Momentum ScoreA
VGM ScoreA
Within each Score, stocks are graded into five groups: A, B, C, D and F. As you might remember from your school days, an A, is better than a B; a B is better than a C; a C is better than a D; and a D is better than an F.
As an investor, you want to buy stocks with the highest probability of success. That means you want to buy stocks with a Zacks Rank #1 or #2, Strong Buy or Buy, which also has a Score of an A or a B in your personal trading style.
Zacks Earnings ESP (Expected Surprise Prediction) looks to find companies that have recently seen positive earnings estimate revision activity. The idea is that more recent information is, generally speaking, more accurate and can be a better predictor of the future, which can give investors an advantage in earnings season.
The technique has proven to be very useful for finding positive surprises. In fact, when combining a Zacks Rank #3 or better and a positive Earnings ESP, stocks produced a positive surprise 70% of the time, while they also saw 28.3% annual returns on average, according to our 10 year backtest.
Paymentus sells cloud bill-pay software and processing. It’s not a pure crypto play, but its digital wallet and real-time rails could benefit if stablecoin-linked wallets increasingly fund everyday bills. In Q1 2026, it delivered record revenue and a record adjusted EBITDA margin, validating a multi-year scale story as more large billers move online. A growing backlog and transaction growth extend the runway as more billers shift to real-time, omni-channel payments.
Potential Risks
Bill pay is competitive, and pricing can compress as large billers negotiate. Slower onboarding, outages, or a broad derating of growth fintech could pressure the stock.
Forecast
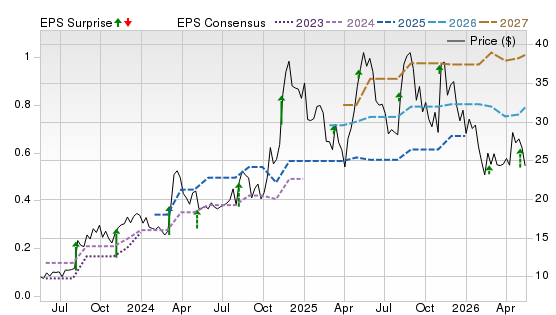
Zacks Rank #2 with Growth and Momentum both at A and a C Value Score indicates supportive revisions and price action. The chart shows 2026-2027 EPS consensus stepping higher, and a run of mostly positive surprises, even as the stock has pulled back from 2025 highs, leaving room for upside if upgrades continue.
This is our short term rating system that serves as a timeliness indicator for stocks over the next 1 to 3 months. How good is it? See rankings and related performance below.
The Zacks Industry Rank assigns a rating to each of the 265 X (Expanded) Industries based on their average Zacks Rank.
An industry with a larger percentage of Zacks Rank #1's and #2's will have a better average Zacks Rank than one with a larger percentage of Zacks Rank #4's and #5's.
The industry with the best average Zacks Rank would be considered the top industry (1 out of 265), which would place it in the top 1% of Zacks Ranked Industries. The industry with the worst average Zacks Rank (265 out of 265) would place in the bottom 1%.
The Zacks Sector Rank assigns a rating to each of the 16 Sectors based on their average Zacks Rank.
A sector with a larger percentage of Zacks Rank #1's and #2's will have a better average Zacks Rank than one with a larger percentage of Zacks Rank #4's and #5's.
The sector with the best average Zacks Rank would be considered the top sector (1 out of 16), which would place it in the top 1% of Zacks Ranked Sectors. The sector with the worst average Zacks Rank (16 out of 16) would place in the bottom 1%.
The Style Scores are a complementary set of indicators to use alongside the Zacks Rank. It allows the user to better focus on the stocks that are the best fit for his or her personal trading style.
The scores are based on the trading styles of Value, Growth, and Momentum. There's also a VGM Score ('V' for Value, 'G' for Growth and 'M' for Momentum), which combines the weighted average of the individual style scores into one score.
Value ScoreA
Growth ScoreA
Momentum ScoreA
VGM ScoreA
Within each Score, stocks are graded into five groups: A, B, C, D and F. As you might remember from your school days, an A, is better than a B; a B is better than a C; a C is better than a D; and a D is better than an F.
As an investor, you want to buy stocks with the highest probability of success. That means you want to buy stocks with a Zacks Rank #1 or #2, Strong Buy or Buy, which also has a Score of an A or a B in your personal trading style.
Zacks Earnings ESP (Expected Surprise Prediction) looks to find companies that have recently seen positive earnings estimate revision activity. The idea is that more recent information is, generally speaking, more accurate and can be a better predictor of the future, which can give investors an advantage in earnings season.
The technique has proven to be very useful for finding positive surprises. In fact, when combining a Zacks Rank #3 or better and a positive Earnings ESP, stocks produced a positive surprise 70% of the time, while they also saw 28.3% annual returns on average, according to our 10 year backtest.
Visa runs the largest card network and is building crypto exposure through stablecoin settlement and tokenization services that keep it relevant as value moves on-chain. Fiscal Q2 showed the model still throws off cash, with 17% revenue growth, and adjusted EPS increase, supported by payment volume growth and value-added services; Visa also announced a new $20 billion buyback authorization. Scale and pricing power make it a steadier way to play digital-dollar adoption without taking token price risk.
Potential Risks
Regulatory and antitrust scrutiny can pressure fees, and a global slowdown can hit cross-border volumes. Real-time account-to-account systems and stablecoin-native wallets could erode pricing power over time.
Forecast
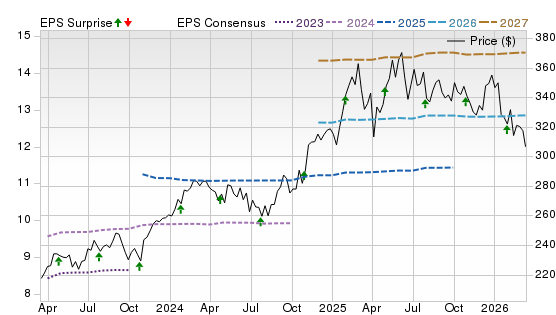
Zacks Rank #2 with D scores for Value, Growth, and Momentum suggests limited Style-score support. The chart shows 2026-2027 EPS consensus trending higher with mostly positive surprises, while the stock is consolidating near highs, making further upside reliant on continued estimate lifts.
The Zacks Rank is a proprietary stock-rating model that uses trends in earnings estimate revisions and earnings-per-share (EPS) surprises to classify stocks into five groups: #1 (Strong Buy), #2 (Buy), #3 (Hold), #4 (Sell) and #5 (Strong Sell). The Zacks Rank is calculated through four primary factors related to earnings estimates: analysts' consensus on earnings estimate revisions, the magnitude of revision change, the upside potential and estimate surprise (or the degree in which earnings per share deviated from the previous quarter).
Zacks builds the data from 3,000 analysts at over 150 different brokerage firms. The average yearly gain for Zacks Rank #1 (Strong Buy) stocks is +23.62% per year from January, 1988, through June 2, 2025.
Selections for Best Crypto Stocks are based on the current top ranking stocks based on Zacks Indicator Score, Style Scores and fundamentals. All stocks have a daily trading volume of at least 100,000 shares and have a stock price of at least $5. All information is current as of market open, May 22, 2026.
Learn More About Crypto Stocks
What Are Crypto Stocks?
Crypto stocks are publicly traded companies whose revenue or growth prospects are meaningfully tied to cryptocurrency markets or blockchain technology.
Examples include:
Crypto exchanges like Coinbase Global (COIN).
Bitcoin miners like CleanSpark (CLSK).
Blockchain software firms like MicroStrategy (MSTR).
Some companies, like MicroStrategy, hold large Bitcoin reserves on their balance sheets, effectively functioning as leveraged Bitcoin proxies.
What Does It Mean to Invest in Crypto Stocks?
Buying crypto stocks means purchasing equity in companies that:
Facilitate crypto trading.
Mine digital assets.
Develop blockchain infrastructure.
Hold cryptocurrencies as corporate treasury assets.
Provide custody or payment services.
Unlike owning Bitcoin directly, investors gain exposure through traditional brokerage accounts, often within retirement plans like IRAs.
How Do Crypto Stocks Make Money?
Revenue models vary by category:
Exchanges earn trading fees and custody revenue (e.g., Coinbase).
Miners earn block rewards and transaction fees for validating blockchain transactions.
Treasury holders benefit when the value of Bitcoin held on their balance sheet rises.
Fintech platforms earn transaction or service fees tied to crypto activity.
For instance, Block Inc. (SQ) generates revenue through digital payments and crypto-related services inside its Cash App ecosystem.
What Industries Gain From Blockchain Besides Crypto Mining?
Blockchain technology extends beyond digital currencies. Beneficiaries include:
Financial services (settlement efficiency).
Supply chain management.
Digital identity verification.
Gaming and NFTs.
Smart contracts in real estate.
Companies such as NVIDIA (NVDA) also benefit indirectly, as crypto mining increases demand for advanced chips and GPUs.
Types of Crypto Stocks
Crypto Exchanges
Coinbase Global (COIN)
Bitcoin Miners
Marathon Digital Holdings (MARA)
Riot Platforms (RIOT)
Crypto Treasury Companies
MicroStrategy (MSTR)
Fintech with Crypto Exposure
Block Inc. (SQ)
PayPal (PYPL)
Semiconductor Providers
NVIDIA (NVDA)
Are There Crypto Dividend Stocks?
Most pure-play crypto firms reinvest cash into growth rather than paying dividends. Mining companies and exchanges typically do not offer regular dividends.
Are There Dividend-Paying Crypto Stocks?
Some diversified financial firms with limited crypto exposure may pay dividends, but investors seeking yield will generally find limited options in this sector.
Benefits, Risks and Safety of Crypto Stocks
Benefits of Crypto Stocks
Easier access through brokerage accounts.
Potential leverage to Bitcoin upside.
Regulatory oversight compared with offshore crypto platforms.
Eligibility for retirement accounts.
Risks of Crypto Stocks
Extreme price volatility.
Regulatory uncertainty.
High correlation to Bitcoin.
Operational risk (especially for miners).
Competitive fee pressure among exchanges.
Are Crypto Stocks Safer Than Crypto?
Crypto stocks trade on regulated exchanges and file audited financial statements, offering more transparency than many digital assets. However, they still carry substantial market risk and can be highly speculative.
Are Crypto Stocks Too Risky for Long-Term Investing?
That depends on risk tolerance. Some investors view blockchain infrastructure as a long-term growth theme, while others see it as cyclical and sentiment-driven.
Diversification is critical.
Why Are Crypto Stocks Crashing (or Surging)?
Crypto stocks typically move due to:
Bitcoin price swings.
ETF approvals or denials.
Regulatory news.
Earnings surprises.
Macro liquidity conditions.
They often amplify Bitcoin’s moves in both directions.
How Do Crypto Stocks Perform During Bull Markets vs Bear Markets?
Bull markets: Mining stocks and exchanges often outperform Bitcoin due to operating leverage.
Bear markets: Revenue declines can compress margins quickly, leading to steeper stock drawdowns.
What Regulations Could Affect Crypto Companies?
Key regulatory factors include:
SEC classification of tokens as securities.
Stablecoin oversight.
Anti-money laundering compliance.
ETF approvals.
Mining-related environmental policy.
Changes in regulatory stance can dramatically shift investor sentiment.
Crypto Stock Market Performance and Price Correlation
Which Crypto Stock Benefits Most if Bitcoin Goes Up?
Mining companies such as Marathon Digital Holdings (MARA) often show the highest beta to Bitcoin price increases.
Which Stocks Benefit the Most When Bitcoin Goes Up?
Miners (MARA, RIOT)
Treasury holders (MSTR)
Exchanges (COIN)
Each responds differently depending on cost structure and trading activity.
What Happens to Crypto Stocks After Bitcoin Halving?
Bitcoin halving reduces block rewards for miners. Historically:
Short term: Margin pressure for less efficient miners.
Long term: If Bitcoin price rises, stronger miners may benefit.
Will Bitcoin Halving Increase the Value of Crypto Stocks?
It can — but only if Bitcoin’s price appreciation offsets reduced mining rewards.
How Will Bitcoin ETF Approvals Impact Crypto Stocks?
Spot Bitcoin ETF approvals typically:
Increase institutional participation.
Improve sentiment.
Potentially shift trading volume from exchanges to ETFs.
Exchange stocks may see mixed effects, while miners often benefit from rising asset prices.
How to Select Crypto Stocks
Investors should evaluate:
Balance-sheet strength
Mining efficiency (cost per coin)
Revenue diversification
Regulatory exposure
Cash reserves
High debt can amplify both upside and downside.
How to Buy Crypto Stocks
You can purchase crypto stocks:
Through traditional brokerage accounts
Inside retirement accounts
Via ETFs focused on crypto or blockchain companies
No digital wallet required.
Which Crypto ETF Is Better: BTC ETF or Crypto Mining Stock ETF?
A spot Bitcoin ETF provides direct exposure to Bitcoin’s price.
A crypto mining ETF offers diversified exposure to companies like Marathon and Riot, potentially amplifying gains — and losses.
The better choice depends on whether you prefer:
Pure asset exposure (Bitcoin ETF).
Equity-based operational leverage (mining ETF).
Final Thoughts
The best crypto stocks give investors exposure to digital assets without requiring them to directly own cryptocurrencies. Companies such as Coinbase, Marathon Digital Holdings, Riot Platforms, MicroStrategy, Block Inc., PayPal, and NVIDIA offer varying degrees of sensitivity to Bitcoin and the broader pace of blockchain adoption.
These stocks can generate outsized returns during crypto bull markets, particularly when rising digital asset prices drive higher trading activity, mining profitability, or infrastructure demand. At the same time, their close connection to the cryptocurrency ecosystem means they often experience sharp swings during market downturns.
As with any emerging industry, careful stock selection, diversification, and disciplined risk management remain essential for investors considering exposure to the crypto economy through publicly traded companies.




 View the Zacks #1 Rank List


 Strong Buy