We use cookies to understand how you use our site and to improve your experience.
This includes personalizing content and advertising.
By pressing "Accept All" or closing out of this banner, you consent to the use of all cookies and similar technologies and the sharing of information they collect with third parties.
You can reject marketing cookies by pressing "Deny Optional," but we still use essential, performance, and functional cookies.
In addition, whether you "Accept All," Deny Optional," click the X or otherwise continue to use the site, you accept our Privacy Policy and Terms of Service, revised from time to time.
You are being directed to ZacksTrade, a division of LBMZ Securities and licensed broker-dealer. ZacksTrade and Zacks.com are separate companies. The web link between the two companies is not a solicitation or offer to invest in a particular security or type of security. ZacksTrade does not endorse or adopt any particular investment strategy, any analyst opinion/rating/report or any approach to evaluating individual securities.
If you wish to go to ZacksTrade, click OK. If you do not, click Cancel.
Earnings per share, or EPS, is one of the most widely used indicators of a company’s profitability.
High EPS can be an attractive signal, but on its own doesn't make a compelling investment.
Stocks to buy with the best EPS trends include Telefônica Brasil, Kennametal and TechnipFMC.
Earnings per share, or EPS, remains one of the most widely used indicators of a company’s profitability and financial health. Investors screening for high EPS stocks are generally seeking businesses with strong earnings power, consistent growth, and the ability to deliver returns that outpace the broader market.
In 2026, opportunities tied to robust EPS are appearing across a range of sectors, including technology, consumer staples, and industrials. Many of these candidates are large, established companies with proven earnings strength, alongside select growth names that may still be undervalued relative to their profit potential.
Is it good to invest in high EPS stocks?
High EPS can be an attractive signal because it reflects a company’s ability to generate meaningful profits relative to its share count. Businesses with expanding earnings often benefit from solid fundamentals, healthy cash flow, and greater flexibility to reinvest in operations or return capital to shareholders through dividends and buybacks.
However, EPS on its own does not make a stock a compelling investment. A company can report strong earnings while still trading at an excessive valuation or facing headwinds that could limit future growth.
What is a good EPS for stocks?
There is no single benchmark that defines a good EPS. Instead, investors typically assess it in context, focusing on several key factors.
Industry comparisons (tech vs. utilities, for example).Different sectors operate under distinct cost structures and growth expectations, so benchmarking EPS against direct peers provides a more meaningful measure of performance.
Growth trends over time. A steadily rising EPS is often more valuable than a high but flat figure, as it reflects improving profitability and supports long-term compounding potential.
Consistency of earnings. Companies that deliver reliable results across multiple periods tend to carry lower risk than those with volatile or uneven earnings profiles.
Valuation ratios like P/E. EPS should always be assessed alongside valuation to avoid overpaying for earnings that may already be fully reflected in the stock price.
In practice, a “good” EPS is less about the absolute number and more about the trajectory, stability, and relative strength of a company’s earnings.
Below, we examine and rank the best EPS stocks using historical results, projected earnings growth, and a combination of Zacks Rank signals and core fundamental measures to identify companies that may offer durable, long-term opportunities for patient investors.
This is our short term rating system that serves as a timeliness indicator for stocks over the next 1 to 3 months. How good is it? See rankings and related performance below.
The Zacks Industry Rank assigns a rating to each of the 265 X (Expanded) Industries based on their average Zacks Rank.
An industry with a larger percentage of Zacks Rank #1's and #2's will have a better average Zacks Rank than one with a larger percentage of Zacks Rank #4's and #5's.
The industry with the best average Zacks Rank would be considered the top industry (1 out of 265), which would place it in the top 1% of Zacks Ranked Industries. The industry with the worst average Zacks Rank (265 out of 265) would place in the bottom 1%.
The Zacks Sector Rank assigns a rating to each of the 16 Sectors based on their average Zacks Rank.
A sector with a larger percentage of Zacks Rank #1's and #2's will have a better average Zacks Rank than one with a larger percentage of Zacks Rank #4's and #5's.
The sector with the best average Zacks Rank would be considered the top sector (1 out of 16), which would place it in the top 1% of Zacks Ranked Sectors. The sector with the worst average Zacks Rank (16 out of 16) would place in the bottom 1%.
The Style Scores are a complementary set of indicators to use alongside the Zacks Rank. It allows the user to better focus on the stocks that are the best fit for his or her personal trading style.
The scores are based on the trading styles of Value, Growth, and Momentum. There's also a VGM Score ('V' for Value, 'G' for Growth and 'M' for Momentum), which combines the weighted average of the individual style scores into one score.
Value ScoreA
Growth ScoreA
Momentum ScoreA
VGM ScoreA
Within each Score, stocks are graded into five groups: A, B, C, D and F. As you might remember from your school days, an A, is better than a B; a B is better than a C; a C is better than a D; and a D is better than an F.
As an investor, you want to buy stocks with the highest probability of success. That means you want to buy stocks with a Zacks Rank #1 or #2, Strong Buy or Buy, which also has a Score of an A or a B in your personal trading style.
Zacks Earnings ESP (Expected Surprise Prediction) looks to find companies that have recently seen positive earnings estimate revision activity. The idea is that more recent information is, generally speaking, more accurate and can be a better predictor of the future, which can give investors an advantage in earnings season.
The technique has proven to be very useful for finding positive surprises. In fact, when combining a Zacks Rank #3 or better and a positive Earnings ESP, stocks produced a positive surprise 70% of the time, while they also saw 28.3% annual returns on average, according to our 10 year backtest.
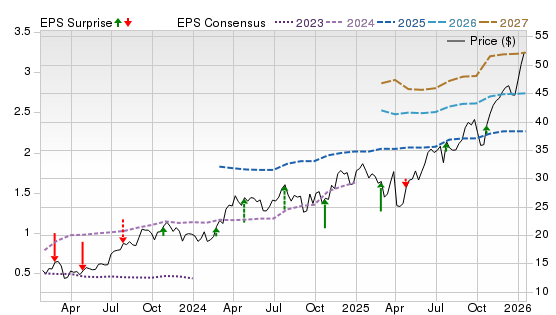
Telefônica Brasil, branded Vivo, sells wireless, broadband and digital services across Brazil. In Q4 2025, revenue rose again while EBITDA and net income grew faster, reflecting postpaid subscriber gains, higher ARPU and continued FTTH ramp that translated operating leverage into sturdier EPS. Scale and a recurring service mix support cash generation for 5G and fiber while still funding returns.
Potential Risks
A more promotional price environment or higher capex and spectrum costs could squeeze margins. ADR holders also face real-dollar volatility and regulatory shifts that can change competitive behavior.
Forecast
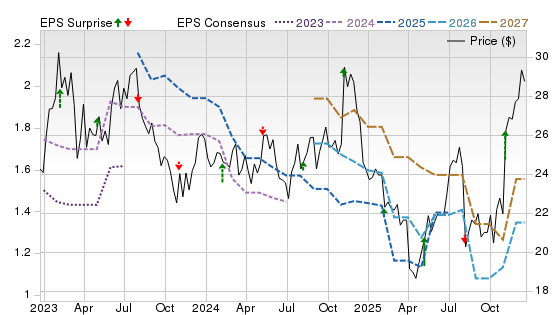
A Zacks Rank #1 (Strong Buy) with Style Scores of A for Momentum and C for Value and Growth signals supportive revisions and price action. On the Price, Consensus & EPS Surprise chart, the 2026 consensus sits above the 2025 trend, and the 2027 trend is higher still. Surprises recently skew to modest beats.
This is our short term rating system that serves as a timeliness indicator for stocks over the next 1 to 3 months. How good is it? See rankings and related performance below.
The Zacks Industry Rank assigns a rating to each of the 265 X (Expanded) Industries based on their average Zacks Rank.
An industry with a larger percentage of Zacks Rank #1's and #2's will have a better average Zacks Rank than one with a larger percentage of Zacks Rank #4's and #5's.
The industry with the best average Zacks Rank would be considered the top industry (1 out of 265), which would place it in the top 1% of Zacks Ranked Industries. The industry with the worst average Zacks Rank (265 out of 265) would place in the bottom 1%.
The Zacks Sector Rank assigns a rating to each of the 16 Sectors based on their average Zacks Rank.
A sector with a larger percentage of Zacks Rank #1's and #2's will have a better average Zacks Rank than one with a larger percentage of Zacks Rank #4's and #5's.
The sector with the best average Zacks Rank would be considered the top sector (1 out of 16), which would place it in the top 1% of Zacks Ranked Sectors. The sector with the worst average Zacks Rank (16 out of 16) would place in the bottom 1%.
The Style Scores are a complementary set of indicators to use alongside the Zacks Rank. It allows the user to better focus on the stocks that are the best fit for his or her personal trading style.
The scores are based on the trading styles of Value, Growth, and Momentum. There's also a VGM Score ('V' for Value, 'G' for Growth and 'M' for Momentum), which combines the weighted average of the individual style scores into one score.
Value ScoreA
Growth ScoreA
Momentum ScoreA
VGM ScoreA
Within each Score, stocks are graded into five groups: A, B, C, D and F. As you might remember from your school days, an A, is better than a B; a B is better than a C; a C is better than a D; and a D is better than an F.
As an investor, you want to buy stocks with the highest probability of success. That means you want to buy stocks with a Zacks Rank #1 or #2, Strong Buy or Buy, which also has a Score of an A or a B in your personal trading style.
Zacks Earnings ESP (Expected Surprise Prediction) looks to find companies that have recently seen positive earnings estimate revision activity. The idea is that more recent information is, generally speaking, more accurate and can be a better predictor of the future, which can give investors an advantage in earnings season.
The technique has proven to be very useful for finding positive surprises. In fact, when combining a Zacks Rank #3 or better and a positive Earnings ESP, stocks produced a positive surprise 70% of the time, while they also saw 28.3% annual returns on average, according to our 10 year backtest.
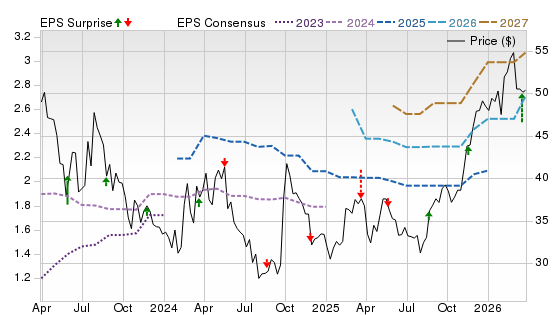
Kennametal makes metal-cutting tools and wear-resistant components used in aerospace, defense, energy and general engineering. In fiscal Q2 2026, results beat the high end of management’s outlook as pricing actions, tariff surcharges and restructuring savings helped protect profitability despite mixed demand, keeping EPS resilient after a choppy prior year. As industrial activity normalizes, the consumables-heavy model can convert incremental volume into outsized earnings.
Potential Risks
End markets can stay uneven, and the quarter benefited from buy-ahead tied to tungsten pricing that may not repeat. Ongoing restructuring carries execution risk, and higher raw-material costs or weaker pricing could pressure margins.
Forecast
A Zacks Rank #1 with Momentum A points to a favorable estimate direction, even with C for Value and Growth. The chart shows 2026 consensus recovering, with 2027 stepping higher again. Surprises are mixed, so sustained order stability matters most for the 2026-2027 uptrend.
This is our short term rating system that serves as a timeliness indicator for stocks over the next 1 to 3 months. How good is it? See rankings and related performance below.
The Zacks Industry Rank assigns a rating to each of the 265 X (Expanded) Industries based on their average Zacks Rank.
An industry with a larger percentage of Zacks Rank #1's and #2's will have a better average Zacks Rank than one with a larger percentage of Zacks Rank #4's and #5's.
The industry with the best average Zacks Rank would be considered the top industry (1 out of 265), which would place it in the top 1% of Zacks Ranked Industries. The industry with the worst average Zacks Rank (265 out of 265) would place in the bottom 1%.
The Zacks Sector Rank assigns a rating to each of the 16 Sectors based on their average Zacks Rank.
A sector with a larger percentage of Zacks Rank #1's and #2's will have a better average Zacks Rank than one with a larger percentage of Zacks Rank #4's and #5's.
The sector with the best average Zacks Rank would be considered the top sector (1 out of 16), which would place it in the top 1% of Zacks Ranked Sectors. The sector with the worst average Zacks Rank (16 out of 16) would place in the bottom 1%.
The Style Scores are a complementary set of indicators to use alongside the Zacks Rank. It allows the user to better focus on the stocks that are the best fit for his or her personal trading style.
The scores are based on the trading styles of Value, Growth, and Momentum. There's also a VGM Score ('V' for Value, 'G' for Growth and 'M' for Momentum), which combines the weighted average of the individual style scores into one score.
Value ScoreA
Growth ScoreA
Momentum ScoreA
VGM ScoreA
Within each Score, stocks are graded into five groups: A, B, C, D and F. As you might remember from your school days, an A, is better than a B; a B is better than a C; a C is better than a D; and a D is better than an F.
As an investor, you want to buy stocks with the highest probability of success. That means you want to buy stocks with a Zacks Rank #1 or #2, Strong Buy or Buy, which also has a Score of an A or a B in your personal trading style.
Zacks Earnings ESP (Expected Surprise Prediction) looks to find companies that have recently seen positive earnings estimate revision activity. The idea is that more recent information is, generally speaking, more accurate and can be a better predictor of the future, which can give investors an advantage in earnings season.
The technique has proven to be very useful for finding positive surprises. In fact, when combining a Zacks Rank #3 or better and a positive Earnings ESP, stocks produced a positive surprise 70% of the time, while they also saw 28.3% annual returns on average, according to our 10 year backtest.
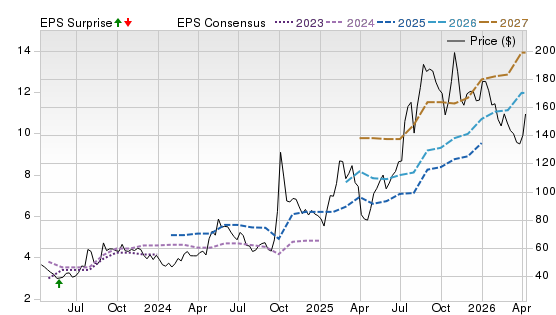
TechnipFMC designs and builds subsea production systems and services for offshore operators. In Q4 2025, adjusted EPS rose year over year while orders stayed strong and backlog remained elevated, reinforcing that execution and a fuller Subsea pipeline are translating into higher-margin work and steadier EPS than earlier in the upcycle. Strong FCF and committed shareholder returns add another layer of support.
Potential Risks
Energy spending is cyclical: weaker oil prices, project deferrals, or cost inflation can disrupt schedules and margins. Large-project delivery also brings contract and FX risk, and valuation can reset quickly if guidance softens.
Forecast
A Zacks Rank #1 with B for Growth and Momentum suggests revisions remain constructive despite a D for Value. The chart’s 2026 and 2027 consensus lines stair-step higher, with 2027 above 2026, and the beat markers are frequent, implying estimates can continue rising if execution holds.
This is our short term rating system that serves as a timeliness indicator for stocks over the next 1 to 3 months. How good is it? See rankings and related performance below.
The Zacks Industry Rank assigns a rating to each of the 265 X (Expanded) Industries based on their average Zacks Rank.
An industry with a larger percentage of Zacks Rank #1's and #2's will have a better average Zacks Rank than one with a larger percentage of Zacks Rank #4's and #5's.
The industry with the best average Zacks Rank would be considered the top industry (1 out of 265), which would place it in the top 1% of Zacks Ranked Industries. The industry with the worst average Zacks Rank (265 out of 265) would place in the bottom 1%.
The Zacks Sector Rank assigns a rating to each of the 16 Sectors based on their average Zacks Rank.
A sector with a larger percentage of Zacks Rank #1's and #2's will have a better average Zacks Rank than one with a larger percentage of Zacks Rank #4's and #5's.
The sector with the best average Zacks Rank would be considered the top sector (1 out of 16), which would place it in the top 1% of Zacks Ranked Sectors. The sector with the worst average Zacks Rank (16 out of 16) would place in the bottom 1%.
The Style Scores are a complementary set of indicators to use alongside the Zacks Rank. It allows the user to better focus on the stocks that are the best fit for his or her personal trading style.
The scores are based on the trading styles of Value, Growth, and Momentum. There's also a VGM Score ('V' for Value, 'G' for Growth and 'M' for Momentum), which combines the weighted average of the individual style scores into one score.
Value ScoreA
Growth ScoreA
Momentum ScoreA
VGM ScoreA
Within each Score, stocks are graded into five groups: A, B, C, D and F. As you might remember from your school days, an A, is better than a B; a B is better than a C; a C is better than a D; and a D is better than an F.
As an investor, you want to buy stocks with the highest probability of success. That means you want to buy stocks with a Zacks Rank #1 or #2, Strong Buy or Buy, which also has a Score of an A or a B in your personal trading style.
Zacks Earnings ESP (Expected Surprise Prediction) looks to find companies that have recently seen positive earnings estimate revision activity. The idea is that more recent information is, generally speaking, more accurate and can be a better predictor of the future, which can give investors an advantage in earnings season.
The technique has proven to be very useful for finding positive surprises. In fact, when combining a Zacks Rank #3 or better and a positive Earnings ESP, stocks produced a positive surprise 70% of the time, while they also saw 28.3% annual returns on average, according to our 10 year backtest.
Futu runs Moomoo and Futubull, a digital brokerage and wealth platform spanning Hong Kong, the U.S. and other markets. In Q4 2025, revenue jumped and EPS rose sharply. Stronger client assets and funded accounts lifted monetization, revealing meaningful operating leverage as activity and interest income recovered.
Potential Risks
Cross-border brokerage sits under heavy regulatory scrutiny, and tighter rules on marketing, account opening or capital flows could slow growth and raise compliance costs. Results are also sensitive to market volatility, which can swing trading revenue and client sentiment.
Forecast
A Zacks Rank #1 reflects favorable estimate revisions, but F for Value and C for Growth and Momentum signal the stock can be sentiment-driven. The chart shows 2026 consensus rising and 2027 accelerating higher, with fewer recent surprise markers, suggesting further upside depends more on continued upward revisions than repeated blowout beats.
This is our short term rating system that serves as a timeliness indicator for stocks over the next 1 to 3 months. How good is it? See rankings and related performance below.
The Zacks Industry Rank assigns a rating to each of the 265 X (Expanded) Industries based on their average Zacks Rank.
An industry with a larger percentage of Zacks Rank #1's and #2's will have a better average Zacks Rank than one with a larger percentage of Zacks Rank #4's and #5's.
The industry with the best average Zacks Rank would be considered the top industry (1 out of 265), which would place it in the top 1% of Zacks Ranked Industries. The industry with the worst average Zacks Rank (265 out of 265) would place in the bottom 1%.
The Zacks Sector Rank assigns a rating to each of the 16 Sectors based on their average Zacks Rank.
A sector with a larger percentage of Zacks Rank #1's and #2's will have a better average Zacks Rank than one with a larger percentage of Zacks Rank #4's and #5's.
The sector with the best average Zacks Rank would be considered the top sector (1 out of 16), which would place it in the top 1% of Zacks Ranked Sectors. The sector with the worst average Zacks Rank (16 out of 16) would place in the bottom 1%.
The Style Scores are a complementary set of indicators to use alongside the Zacks Rank. It allows the user to better focus on the stocks that are the best fit for his or her personal trading style.
The scores are based on the trading styles of Value, Growth, and Momentum. There's also a VGM Score ('V' for Value, 'G' for Growth and 'M' for Momentum), which combines the weighted average of the individual style scores into one score.
Value ScoreA
Growth ScoreA
Momentum ScoreA
VGM ScoreA
Within each Score, stocks are graded into five groups: A, B, C, D and F. As you might remember from your school days, an A, is better than a B; a B is better than a C; a C is better than a D; and a D is better than an F.
As an investor, you want to buy stocks with the highest probability of success. That means you want to buy stocks with a Zacks Rank #1 or #2, Strong Buy or Buy, which also has a Score of an A or a B in your personal trading style.
Zacks Earnings ESP (Expected Surprise Prediction) looks to find companies that have recently seen positive earnings estimate revision activity. The idea is that more recent information is, generally speaking, more accurate and can be a better predictor of the future, which can give investors an advantage in earnings season.
The technique has proven to be very useful for finding positive surprises. In fact, when combining a Zacks Rank #3 or better and a positive Earnings ESP, stocks produced a positive surprise 70% of the time, while they also saw 28.3% annual returns on average, according to our 10 year backtest.
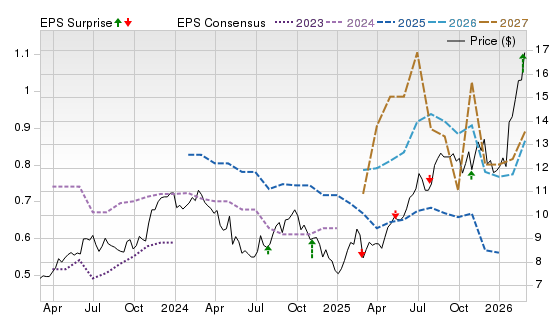
H World operates and franchises hotels across China and internationally under brands such as HanTing and JI. In Q4 2025, profitability rebounded sharply year over year and management pointed to improving RevPAR and continued network expansion, with the asset-light mix helping convert revenue gains into stronger EPS versus the more volatile post-pandemic comparisons.
Potential Risks
China travel demand can soften quickly, and aggressive supply growth can pressure pricing. Rapid openings add execution risk, while labor and renovation costs can rise. ADR sentiment is also exposed to geopolitical headlines and policy shifts.
Forecast
A Zacks Rank #1 paired with Growth A and Momentum B signals supportive revisions and an improving trend, despite Value C. On the chart, the 2026 consensus turns higher after a softer 2025 line, and 2027 climbs above 2026. Surprise markers are mixed, so cleaner beats are important to keep estimates advancing.
The Zacks Rank is a proprietary stock-rating model that uses trends in earnings estimate revisions and earnings-per-share (EPS) surprises to classify stocks into five groups: #1 (Strong Buy), #2 (Buy), #3 (Hold), #4 (Sell) and #5 (Strong Sell). The Zacks Rank is calculated through four primary factors related to earnings estimates: analysts' consensus on earnings estimate revisions, the magnitude of revision change, the upside potential and estimate surprise (or the degree in which earnings per share deviated from the previous quarter).
Zacks builds the data from 3,000 analysts at over 150 different brokerage firms. The average yearly gain for Zacks Rank #1 (Strong Buy) stocks is +23.62% per year from January, 1988, through June 2, 2025.
Selections for Best EPS Stocks are based on historical performance for earnings per share, as well as forecasted EPS performance, along with the current top ranking stocks based on Zacks Indicator Score, Style Scores and fundamentals. All stocks have a daily trading volume of at least 100,000 shares and have a stock price of at least $5. All information is current as of market open, April 17, 2026.
Guide to Best EPS Stocks
What does EPS mean in stocks?
EPS (earnings per share) measures a company’s net income divided by its total outstanding shares. It shows how much profit is attributed to each share of stock.
EPS is a core indicator of profitability and is often used by analysts to compare companies within the same sector.
Why invest in high EPS stocks
Strong EPS often signals efficient management and profitability.
Companies with rising EPS tend to attract institutional investors.
High earnings can support stock price appreciation over time.
What is considered a high EPS?
A high EPS depends on context, but generally:
Large-cap companies with double-digit EPS growth are attractive.
Stocks with consistently rising EPS over multiple quarters stand out.
A high EPS relative to competitors is often more meaningful than the raw number.
Pros of investing in high EPS stocks
Strong profitability: High EPS reflects solid earnings performance.
Potential for capital gains: Earnings growth often drives stock prices higher.
Dividend potential: Profitable companies may return cash to shareholders.
Market confidence: High EPS companies often attract institutional support.
Cons of investing in high EPS stocks
Overvaluation risk: High EPS stocks can trade at premium prices.
Earnings volatility: EPS can fluctuate due to economic cycles.
Accounting distortions: One-time gains can inflate EPS.
Sector bias: Some industries naturally have higher EPS than others.
How to choose the high EPS Stocks
When screening for top EPS stocks, consider:
Consistent earnings growth over multiple quarters or years.
Many investors also look for companies included in major growth lists or earnings gainers with strong forward guidance.
How to invest in high EPS stocks
To invest effectively:
Use stock screeners to identify companies with top EPS and growth rates.
Compare companies within the same industry.
Evaluate valuation metrics like P/E ratio.
Diversify across sectors to reduce risk.
Monitor quarterly earnings reports for changes.
What other metrics should I consider besides EPS?
EPS should never be used in isolation. Combine it with:
P/E ratio (valuation relative to earnings).
Revenue growth.
Return on equity (ROE).
Free cash flow.
Debt-to-equity ratio.
These metrics provide a fuller picture of financial health.
Tips for Building a High EPS Portfolio
Focus on quality over quantity—strong, consistent earners.
Blend growth stocks and stable blue chips.
Avoid chasing stocks with sudden EPS spikes.
Rebalance regularly based on earnings performance.
Keep a long-term perspective rather than reacting to short-term fluctuations.
Frequently Asked Questions About EPS Stocks
What is an EPS Trap?
An EPS trap occurs when a stock appears attractive due to high earnings, but the growth is unsustainable. This can happen due to:
One-time gains (asset sales, tax benefits)
Cost-cutting rather than real growth
Declining revenue masked by accounting adjustments
Can EPS be manipulated or misleading?
Yes. EPS can be influenced by:
Share buybacks (reducing share count boosts EPS)
Accounting adjustments
Non-recurring income
That’s why investors should always look at adjusted EPS and underlying fundamentals.
Do high EPS stocks pay better dividends?
Not always, but often:
Companies with strong earnings are more capable of paying dividends.
Some high-growth companies reinvest earnings instead of paying dividends.
Dividend yield depends on company strategy, not just EPS.
What’s the difference between the EPS and PE ratio?
EPS measures profitability per share
P/E ratio measures how much investors are willing to pay for that earnings
In simple terms:
EPS = earnings strength
P/E = valuation of those earnings
Both are essential for identifying the best EPS stocks to buy.
Bottom line: High EPS stocks can be powerful additions to a portfolio—but the best opportunities come from companies with consistent earnings growth, reasonable valuations, and strong fundamentals, not just the highest headline numbers.


 Strong Buy