We use cookies to understand how you use our site and to improve your experience.
This includes personalizing content and advertising.
By pressing "Accept All" or closing out of this banner, you consent to the use of all cookies and similar technologies and the sharing of information they collect with third parties.
You can reject marketing cookies by pressing "Deny Optional," but we still use essential, performance, and functional cookies.
In addition, whether you "Accept All," Deny Optional," click the X or otherwise continue to use the site, you accept our Privacy Policy and Terms of Service, revised from time to time.
You are being directed to ZacksTrade, a division of LBMZ Securities and licensed broker-dealer. ZacksTrade and Zacks.com are separate companies. The web link between the two companies is not a solicitation or offer to invest in a particular security or type of security. ZacksTrade does not endorse or adopt any particular investment strategy, any analyst opinion/rating/report or any approach to evaluating individual securities.
If you wish to go to ZacksTrade, click OK. If you do not, click Cancel.
Zacks looks at stocks recently upgraded to a “Strong Buy” rating, ranked by the Zacks Indicator Score.
Top five stocks recently earning a #1 rating includes distribution, automotive, transportation, and mining.
Best stocks to buy now include IAMGOLD Corporation, Aura Minerals and Agnico Eagle Mines.
When looking for stocks to buy, new investors often choose names they know – but there are far more potentially profitable stocks out there beyond Meta, NVIDIA, Google or other “Magnificent Seven” stocks.
Professional and institutional investors know better, looking beyond the headlines to search for stocks that are ripe to buy, no matter the company's size, industry or renown.
The Zacks Rank uses four factors related to earnings estimates to classify stocks into five groups, ranging from "Strong Buy" to "Strong Sell." The list below includes some of the latest stocks given a "Strong Buy” rating in the past two weeks, according to Zacks Equity Research, ranked by our proprietary Zacks Indicator Score.
This is our short term rating system that serves as a timeliness indicator for stocks over the next 1 to 3 months. How good is it? See rankings and related performance below.
The Zacks Industry Rank assigns a rating to each of the 265 X (Expanded) Industries based on their average Zacks Rank.
An industry with a larger percentage of Zacks Rank #1's and #2's will have a better average Zacks Rank than one with a larger percentage of Zacks Rank #4's and #5's.
The industry with the best average Zacks Rank would be considered the top industry (1 out of 265), which would place it in the top 1% of Zacks Ranked Industries. The industry with the worst average Zacks Rank (265 out of 265) would place in the bottom 1%.
The Zacks Sector Rank assigns a rating to each of the 16 Sectors based on their average Zacks Rank.
A sector with a larger percentage of Zacks Rank #1's and #2's will have a better average Zacks Rank than one with a larger percentage of Zacks Rank #4's and #5's.
The sector with the best average Zacks Rank would be considered the top sector (1 out of 16), which would place it in the top 1% of Zacks Ranked Sectors. The sector with the worst average Zacks Rank (16 out of 16) would place in the bottom 1%.
The Style Scores are a complementary set of indicators to use alongside the Zacks Rank. It allows the user to better focus on the stocks that are the best fit for his or her personal trading style.
The scores are based on the trading styles of Value, Growth, and Momentum. There's also a VGM Score ('V' for Value, 'G' for Growth and 'M' for Momentum), which combines the weighted average of the individual style scores into one score.
Value ScoreA
Growth ScoreA
Momentum ScoreA
VGM ScoreA
Within each Score, stocks are graded into five groups: A, B, C, D and F. As you might remember from your school days, an A, is better than a B; a B is better than a C; a C is better than a D; and a D is better than an F.
As an investor, you want to buy stocks with the highest probability of success. That means you want to buy stocks with a Zacks Rank #1 or #2, Strong Buy or Buy, which also has a Score of an A or a B in your personal trading style.
Zacks Earnings ESP (Expected Surprise Prediction) looks to find companies that have recently seen positive earnings estimate revision activity. The idea is that more recent information is, generally speaking, more accurate and can be a better predictor of the future, which can give investors an advantage in earnings season.
The technique has proven to be very useful for finding positive surprises. In fact, when combining a Zacks Rank #3 or better and a positive Earnings ESP, stocks produced a positive surprise 70% of the time, while they also saw 28.3% annual returns on average, according to our 10 year backtest.
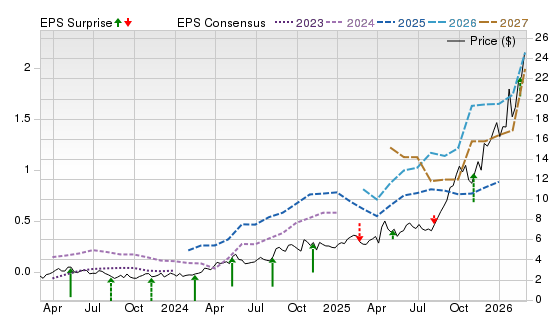
IAMGOLD is a gold producer with growing exposure to Côté Gold, Essakane, and Westwood. In Q4 2025, it delivered record quarterly production across its operations, met the midpoint of full-year guidance, and benefited from stronger gold sales and prices, helping lift annual operating cash flow above $1 billion and strengthen the balance sheet. That marked a clear improvement from Q4 2024, when Côté was still earlier in its ramp and cash generation was less established.
Potential Risks
Gold prices, costs, and execution remain key risks. Setbacks at Côté, Essakane, or Westwood, or higher input costs, could pressure margins.
Forecast
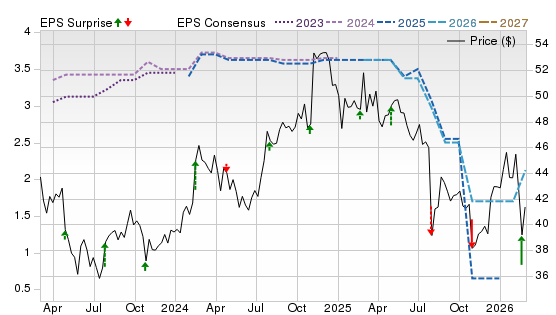
A Zacks Rank #1 (Strong Buy) reflects favorable revisions. The Growth Score of A is the key strength, while the Value Score of C and the Momentum Score of C are neutral. The chart shows strong price gains, higher 2026-2027 estimates, and a favorable recent EPS surprise trend.
This is our short term rating system that serves as a timeliness indicator for stocks over the next 1 to 3 months. How good is it? See rankings and related performance below.
The Zacks Industry Rank assigns a rating to each of the 265 X (Expanded) Industries based on their average Zacks Rank.
An industry with a larger percentage of Zacks Rank #1's and #2's will have a better average Zacks Rank than one with a larger percentage of Zacks Rank #4's and #5's.
The industry with the best average Zacks Rank would be considered the top industry (1 out of 265), which would place it in the top 1% of Zacks Ranked Industries. The industry with the worst average Zacks Rank (265 out of 265) would place in the bottom 1%.
The Zacks Sector Rank assigns a rating to each of the 16 Sectors based on their average Zacks Rank.
A sector with a larger percentage of Zacks Rank #1's and #2's will have a better average Zacks Rank than one with a larger percentage of Zacks Rank #4's and #5's.
The sector with the best average Zacks Rank would be considered the top sector (1 out of 16), which would place it in the top 1% of Zacks Ranked Sectors. The sector with the worst average Zacks Rank (16 out of 16) would place in the bottom 1%.
The Style Scores are a complementary set of indicators to use alongside the Zacks Rank. It allows the user to better focus on the stocks that are the best fit for his or her personal trading style.
The scores are based on the trading styles of Value, Growth, and Momentum. There's also a VGM Score ('V' for Value, 'G' for Growth and 'M' for Momentum), which combines the weighted average of the individual style scores into one score.
Value ScoreA
Growth ScoreA
Momentum ScoreA
VGM ScoreA
Within each Score, stocks are graded into five groups: A, B, C, D and F. As you might remember from your school days, an A, is better than a B; a B is better than a C; a C is better than a D; and a D is better than an F.
As an investor, you want to buy stocks with the highest probability of success. That means you want to buy stocks with a Zacks Rank #1 or #2, Strong Buy or Buy, which also has a Score of an A or a B in your personal trading style.
Zacks Earnings ESP (Expected Surprise Prediction) looks to find companies that have recently seen positive earnings estimate revision activity. The idea is that more recent information is, generally speaking, more accurate and can be a better predictor of the future, which can give investors an advantage in earnings season.
The technique has proven to be very useful for finding positive surprises. In fact, when combining a Zacks Rank #3 or better and a positive Earnings ESP, stocks produced a positive surprise 70% of the time, while they also saw 28.3% annual returns on average, according to our 10 year backtest.
Aura Minerals is a Latin America-focused gold and copper producer translating recent mine builds into higher production and cash flow. In Q4 2025, record output, higher GEOs, and full-year guidance delivery marked a clear improvement from earlier periods affected by operational issues. Borborema added another growth lever, while stronger operating momentum and execution progress supported the case for a growing miner that is also returning cash.
Potential Risks
Mining risk remains meaningful. Cost inflation, grade variability, ramp-up challenges at newer assets, and exposure across Brazil, Mexico, Honduras, and Guatemala could pressure margins if operating performance loses consistency.
Forecast
A Zacks Rank #1 points to positive estimate revisions. The Growth Score of A stands out, while the Value Score of C is neutral and the Momentum Score of D is weaker. The chart shows strong price gains, firmer 2026-2027 estimates, and a mixed recent EPS surprise pattern.
This is our short term rating system that serves as a timeliness indicator for stocks over the next 1 to 3 months. How good is it? See rankings and related performance below.
The Zacks Industry Rank assigns a rating to each of the 265 X (Expanded) Industries based on their average Zacks Rank.
An industry with a larger percentage of Zacks Rank #1's and #2's will have a better average Zacks Rank than one with a larger percentage of Zacks Rank #4's and #5's.
The industry with the best average Zacks Rank would be considered the top industry (1 out of 265), which would place it in the top 1% of Zacks Ranked Industries. The industry with the worst average Zacks Rank (265 out of 265) would place in the bottom 1%.
The Zacks Sector Rank assigns a rating to each of the 16 Sectors based on their average Zacks Rank.
A sector with a larger percentage of Zacks Rank #1's and #2's will have a better average Zacks Rank than one with a larger percentage of Zacks Rank #4's and #5's.
The sector with the best average Zacks Rank would be considered the top sector (1 out of 16), which would place it in the top 1% of Zacks Ranked Sectors. The sector with the worst average Zacks Rank (16 out of 16) would place in the bottom 1%.
The Style Scores are a complementary set of indicators to use alongside the Zacks Rank. It allows the user to better focus on the stocks that are the best fit for his or her personal trading style.
The scores are based on the trading styles of Value, Growth, and Momentum. There's also a VGM Score ('V' for Value, 'G' for Growth and 'M' for Momentum), which combines the weighted average of the individual style scores into one score.
Value ScoreA
Growth ScoreA
Momentum ScoreA
VGM ScoreA
Within each Score, stocks are graded into five groups: A, B, C, D and F. As you might remember from your school days, an A, is better than a B; a B is better than a C; a C is better than a D; and a D is better than an F.
As an investor, you want to buy stocks with the highest probability of success. That means you want to buy stocks with a Zacks Rank #1 or #2, Strong Buy or Buy, which also has a Score of an A or a B in your personal trading style.
Zacks Earnings ESP (Expected Surprise Prediction) looks to find companies that have recently seen positive earnings estimate revision activity. The idea is that more recent information is, generally speaking, more accurate and can be a better predictor of the future, which can give investors an advantage in earnings season.
The technique has proven to be very useful for finding positive surprises. In fact, when combining a Zacks Rank #3 or better and a positive Earnings ESP, stocks produced a positive surprise 70% of the time, while they also saw 28.3% annual returns on average, according to our 10 year backtest.
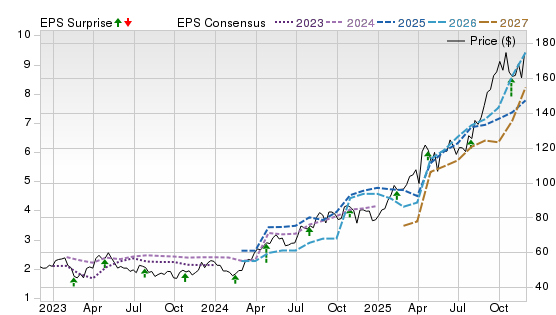
Agnico Eagle is a large gold miner with operations in Canada, Australia, Finland, and Mexico. In Q4 2025, it delivered record quarterly and annual free cash flow, met 2025 production guidance, raised the dividend 12.5%, and updated three-year guidance, extending the strong operational and balance-sheet progress seen in Q4 2024. Year-end exploration updates also showed higher reserves and resources, supporting durable mine-life extension and future production visibility.
Potential Risks
The stock still carries commodity and execution risk. A weaker gold price, cost inflation, permitting delays, or slower progress at large assets and expansions could pressure margins and challenge a premium valuation.
Forecast
A Zacks Rank #1 points to positive estimate revisions. The Growth Score of B is supportive, while the Value Score of D suggests less valuation help and the Momentum Score of C is balanced. The chart shows a strong price uptrend, firmer 2026-2027 estimates, and a favorable recent EPS surprise pattern.
This is our short term rating system that serves as a timeliness indicator for stocks over the next 1 to 3 months. How good is it? See rankings and related performance below.
The Zacks Industry Rank assigns a rating to each of the 265 X (Expanded) Industries based on their average Zacks Rank.
An industry with a larger percentage of Zacks Rank #1's and #2's will have a better average Zacks Rank than one with a larger percentage of Zacks Rank #4's and #5's.
The industry with the best average Zacks Rank would be considered the top industry (1 out of 265), which would place it in the top 1% of Zacks Ranked Industries. The industry with the worst average Zacks Rank (265 out of 265) would place in the bottom 1%.
The Zacks Sector Rank assigns a rating to each of the 16 Sectors based on their average Zacks Rank.
A sector with a larger percentage of Zacks Rank #1's and #2's will have a better average Zacks Rank than one with a larger percentage of Zacks Rank #4's and #5's.
The sector with the best average Zacks Rank would be considered the top sector (1 out of 16), which would place it in the top 1% of Zacks Ranked Sectors. The sector with the worst average Zacks Rank (16 out of 16) would place in the bottom 1%.
The Style Scores are a complementary set of indicators to use alongside the Zacks Rank. It allows the user to better focus on the stocks that are the best fit for his or her personal trading style.
The scores are based on the trading styles of Value, Growth, and Momentum. There's also a VGM Score ('V' for Value, 'G' for Growth and 'M' for Momentum), which combines the weighted average of the individual style scores into one score.
Value ScoreA
Growth ScoreA
Momentum ScoreA
VGM ScoreA
Within each Score, stocks are graded into five groups: A, B, C, D and F. As you might remember from your school days, an A, is better than a B; a B is better than a C; a C is better than a D; and a D is better than an F.
As an investor, you want to buy stocks with the highest probability of success. That means you want to buy stocks with a Zacks Rank #1 or #2, Strong Buy or Buy, which also has a Score of an A or a B in your personal trading style.
Zacks Earnings ESP (Expected Surprise Prediction) looks to find companies that have recently seen positive earnings estimate revision activity. The idea is that more recent information is, generally speaking, more accurate and can be a better predictor of the future, which can give investors an advantage in earnings season.
The technique has proven to be very useful for finding positive surprises. In fact, when combining a Zacks Rank #3 or better and a positive Earnings ESP, stocks produced a positive surprise 70% of the time, while they also saw 28.3% annual returns on average, according to our 10 year backtest.
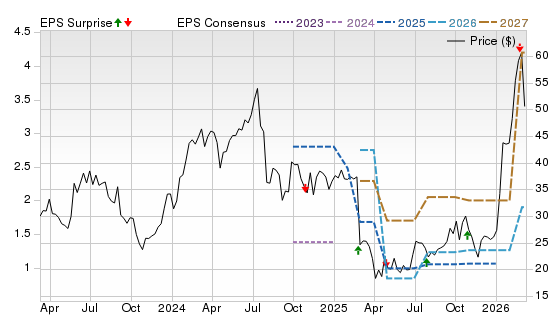
Ultra Clean supplies subsystems, components, and services used in semiconductor manufacturing, giving it leverage to wafer-fab equipment demand. In Q4 2025, revenue reached $506.6 million, and management highlighted disciplined execution in a dynamic environment. The company also exited 2025 with exposure to AI-driven semiconductor spending and a broader service footprint, supporting the case for improving demand and stronger operating momentum as customer investment expands.
Potential Risks
The latest quarter still showed pressure. Revenue declined from a year earlier, the company posted a GAAP net loss, and results remained sensitive to customer timing, fab utilization, and broader semiconductor equipment demand.
Forecast
A Zacks Rank #1 points to positive estimate revisions. The Growth Score of D and Value Score of D are weak, while the Momentum Score of A is the clear strength. The chart shows a sharp recent price move, firmer 2026-2027 estimates, and a mixed but improving EPS surprise trend.
This is our short term rating system that serves as a timeliness indicator for stocks over the next 1 to 3 months. How good is it? See rankings and related performance below.
The Zacks Industry Rank assigns a rating to each of the 265 X (Expanded) Industries based on their average Zacks Rank.
An industry with a larger percentage of Zacks Rank #1's and #2's will have a better average Zacks Rank than one with a larger percentage of Zacks Rank #4's and #5's.
The industry with the best average Zacks Rank would be considered the top industry (1 out of 265), which would place it in the top 1% of Zacks Ranked Industries. The industry with the worst average Zacks Rank (265 out of 265) would place in the bottom 1%.
The Zacks Sector Rank assigns a rating to each of the 16 Sectors based on their average Zacks Rank.
A sector with a larger percentage of Zacks Rank #1's and #2's will have a better average Zacks Rank than one with a larger percentage of Zacks Rank #4's and #5's.
The sector with the best average Zacks Rank would be considered the top sector (1 out of 16), which would place it in the top 1% of Zacks Ranked Sectors. The sector with the worst average Zacks Rank (16 out of 16) would place in the bottom 1%.
The Style Scores are a complementary set of indicators to use alongside the Zacks Rank. It allows the user to better focus on the stocks that are the best fit for his or her personal trading style.
The scores are based on the trading styles of Value, Growth, and Momentum. There's also a VGM Score ('V' for Value, 'G' for Growth and 'M' for Momentum), which combines the weighted average of the individual style scores into one score.
Value ScoreA
Growth ScoreA
Momentum ScoreA
VGM ScoreA
Within each Score, stocks are graded into five groups: A, B, C, D and F. As you might remember from your school days, an A, is better than a B; a B is better than a C; a C is better than a D; and a D is better than an F.
As an investor, you want to buy stocks with the highest probability of success. That means you want to buy stocks with a Zacks Rank #1 or #2, Strong Buy or Buy, which also has a Score of an A or a B in your personal trading style.
Zacks Earnings ESP (Expected Surprise Prediction) looks to find companies that have recently seen positive earnings estimate revision activity. The idea is that more recent information is, generally speaking, more accurate and can be a better predictor of the future, which can give investors an advantage in earnings season.
The technique has proven to be very useful for finding positive surprises. In fact, when combining a Zacks Rank #3 or better and a positive Earnings ESP, stocks produced a positive surprise 70% of the time, while they also saw 28.3% annual returns on average, according to our 10 year backtest.
Employers Holdings is a specialty workers’ compensation insurer focused on small and midsize businesses. In Q4 2025, it reported a stable current accident-year loss ratio, no added reserve strengthening after its actuarial review, a completed $125 million recapitalization plan, and a 32 cents quarterly dividend. Those updates support the case for disciplined capital management.
Potential Risks
Results still reflected pressure, with lower revenue and earnings versus the prior year, while the business remains exposed to claim severity, reserve development, payroll trends, competition, and investment-market volatility.
Forecast
The Zacks Rank #1 reflects improving earnings revisions. Momentum is the standout, with a Momentum Score of A, while the Value Score of C is neutral and the Growth Score of F remains the weakest piece of the profile. On the chart, the stock shows a sharp recent jump, firmer 2026-2027 estimates, and an uneven but generally supportive EPS surprise pattern.
It’s important to understand what this list is, and what it isn’t.
For decades, the Zacks Rank has been a proven system that has helped investors identify stocks most likely to outperform. Instead of relying on hunches or hype, it’s grounded in earnings estimate revisions — a factor strongly correlated with stock price movement. When combined with additional fundamental metrics, the approach becomes even more powerful.
Still, it’s important to understand these basics:
While the list offers exposure across several industries, it is not a fully diversified portfolio. You should think of it as a starting point, not a complete investing strategy.
Even though these stocks are backed by a proven system, nothing protects you from short-term downside. Depending on market conditions, most — or even all — could decline in the near term.
The Zacks Rank works because it captures trends in earnings momentum. That power plays out over weeks and months, not days. Investors with patience and discipline are more likely to benefit.
Before buying any single stock, check how it aligns with your goals, risk tolerance, and broader portfolio.
Methodology
The Zacks Rank is a proprietary stock-rating model that uses trends in earnings estimate revisions and earnings-per-share (EPS) surprises to classify stocks into five groups: #1 (Strong Buy), #2 (Buy), #3 (Hold), #4 (Sell) and #5 (Strong Sell). The Zacks Rank is calculated through four primary factors related to earnings estimates: analysts' consensus on earnings estimate revisions, the magnitude of revision change, the upside potential and estimate surprise (or the degree in which earnings per share deviated from the previous quarter).
Zacks builds the data from 3,000 analysts at over 150 different brokerage firms. The average yearly gain for Zacks Rank #1 (Strong Buy) stocks is +23.62% per year from January, 1988, through June 2, 2025.
For this list, only companies in the top 50% of industries that have average daily trading volumes of 100,000 shares or more were considered. Stocks with a share value of $5 or less were excluded. These companies earned Zacks Rank #1 (Strong Buy) between Feb. 2, 2026 and Feb. 14, 2026. All information is current as of market open, March 9, 2026.
Common Questions of New Investors
Where to Buy Stocks
To invest in stocks, you must open a brokerage account, fund the account and purchase stocks through your selected brokerage. Investors may also purchase stocks through a financial advisor or an automated robo advisor. Some publicly traded companies also offer a direct stock purchase plan, where you can purchase shares directly from the company.
Alternative Ways to Invest in Stocks
You can also invest in stock funds, such as mutual funds, index funds and exchange-traded funds, where the fund managers select the pool of stocks that follow an investing strategy. These funds may broadly cover an entire index, such as the S&P 500, or specific types of stocks, such as industries like technology and energy companies, company size such as small cap companies, or location like international companies.
How to Start Investing in Stocks Today
It’s easy to start investing by opening an online brokerage account. Opening a standard brokerage account takes about 20 minutes and you’ll need to have some personal information ready, such as your social security number and your bank details to fund your account.
You’ll need to decide whether to open a taxable account (most common), a tax-deferred retirement account such as a traditional IRA or a tax-free retirement account such as a Roth IRA, which is funded with after-tax dollars, but qualified withdrawals are tax-free. A margin account allows for borrowing to purchase stocks and is best for experienced traders.
Set goals before you begin investing – determine how much you can afford to invest and your tolerance for risk.
What to Look for When You Buy Stocks?
The goal in all equities investment is to buy low and sell high, growing your wealth over time. Researching the companies to invest in is key – what kind of product or service do they offer? How do they compare with competitors? How fast are they growing? Does the stock pay regular dividends to shareholders? Does the stock help diversify your portfolio by giving you exposure to a market segment you currently don’t hold?
Understanding fundamental analysis can help determine whether the stock has the potential for growth at its current purchase price. Factors that can help determine that include earnings per share (EPS), price-to-earnings ratio and PE growth. Technical analysis is used looking at statistical patterns to potentially predict future price moves. Some investors may look for a growth and income strategy, looking for stocks with solid revenues that pay good dividends, or a value strategy, looking if a current stock price is below what their revenue, EPS and other factors suggest.
Analysts also often look for the momentum of a stock by looking at moving averages of a stock's closing price over a 50-day, 100-day or 12-month trailing time period to determine signals whether to buy or sell a stock.


 Strong Buy
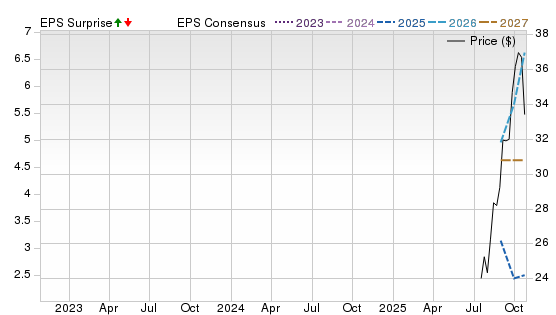


 Stocks to Buy Now March 2026")
