We use cookies to understand how you use our site and to improve your experience.
This includes personalizing content and advertising.
By pressing "Accept All" or closing out of this banner, you consent to the use of all cookies and similar technologies and the sharing of information they collect with third parties.
You can reject marketing cookies by pressing "Deny Optional," but we still use essential, performance, and functional cookies.
In addition, whether you "Accept All," Deny Optional," click the X or otherwise continue to use the site, you accept our Privacy Policy and Terms of Service, revised from time to time.
You are being directed to ZacksTrade, a division of LBMZ Securities and licensed broker-dealer. ZacksTrade and Zacks.com are separate companies. The web link between the two companies is not a solicitation or offer to invest in a particular security or type of security. ZacksTrade does not endorse or adopt any particular investment strategy, any analyst opinion/rating/report or any approach to evaluating individual securities.
If you wish to go to ZacksTrade, click OK. If you do not, click Cancel.
Gold has hit new record highs in the past year as a hedge against uncertain economic conditions.
Rather than invest directly in gold, investors may benefit by investing in gold mining companies.
Besides gold stocks, investors can also get exposure from gold ETFs and mutual funds.
Gold stocks — shares of miners and royalty/streaming companies of the precious metal — offer investors leveraged, indirect exposure to the metal while tying returns to corporate execution. Historically, they’ve helped diversify portfolios and hedge bouts of inflation, tightening liquidity or market stress while providing potential operational upside.
But they are not the same as owning bullion. Earnings quality, cost discipline, jurisdictional risk, balance-sheet strength and management execution can amplify (or mute) what gold prices alone would deliver.
With gold testing record highs, central banks accumulating reserves, and geopolitics unsettled, many analysts see a strategic role for appropriate gold stocks in diversified portfolios. The picks below are ranked on a blend Zacks Rank signals, Style Scores and fundamentals.
This is our short term rating system that serves as a timeliness indicator for stocks over the next 1 to 3 months. How good is it? See rankings and related performance below.
The Zacks Industry Rank assigns a rating to each of the 265 X (Expanded) Industries based on their average Zacks Rank.
An industry with a larger percentage of Zacks Rank #1's and #2's will have a better average Zacks Rank than one with a larger percentage of Zacks Rank #4's and #5's.
The industry with the best average Zacks Rank would be considered the top industry (1 out of 265), which would place it in the top 1% of Zacks Ranked Industries. The industry with the worst average Zacks Rank (265 out of 265) would place in the bottom 1%.
The Zacks Sector Rank assigns a rating to each of the 16 Sectors based on their average Zacks Rank.
A sector with a larger percentage of Zacks Rank #1's and #2's will have a better average Zacks Rank than one with a larger percentage of Zacks Rank #4's and #5's.
The sector with the best average Zacks Rank would be considered the top sector (1 out of 16), which would place it in the top 1% of Zacks Ranked Sectors. The sector with the worst average Zacks Rank (16 out of 16) would place in the bottom 1%.
The Style Scores are a complementary set of indicators to use alongside the Zacks Rank. It allows the user to better focus on the stocks that are the best fit for his or her personal trading style.
The scores are based on the trading styles of Value, Growth, and Momentum. There's also a VGM Score ('V' for Value, 'G' for Growth and 'M' for Momentum), which combines the weighted average of the individual style scores into one score.
Value ScoreA
Growth ScoreA
Momentum ScoreA
VGM ScoreA
Within each Score, stocks are graded into five groups: A, B, C, D and F. As you might remember from your school days, an A, is better than a B; a B is better than a C; a C is better than a D; and a D is better than an F.
As an investor, you want to buy stocks with the highest probability of success. That means you want to buy stocks with a Zacks Rank #1 or #2, Strong Buy or Buy, which also has a Score of an A or a B in your personal trading style.
Zacks Earnings ESP (Expected Surprise Prediction) looks to find companies that have recently seen positive earnings estimate revision activity. The idea is that more recent information is, generally speaking, more accurate and can be a better predictor of the future, which can give investors an advantage in earnings season.
The technique has proven to be very useful for finding positive surprises. In fact, when combining a Zacks Rank #3 or better and a positive Earnings ESP, stocks produced a positive surprise 70% of the time, while they also saw 28.3% annual returns on average, according to our 10 year backtest.
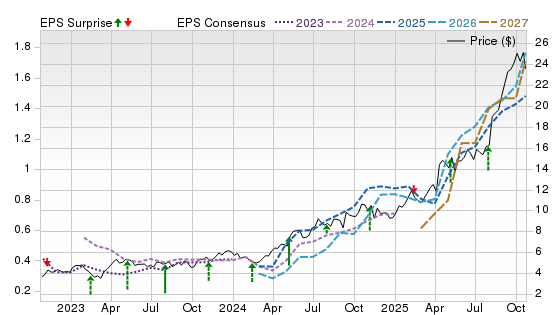
DPM Metals is a mid-tier miner with meaningful gold output from Chelopech and Ada Tepe, now enhanced by the Vares ramp-up. In the latest quarter, it highlighted record earnings and free cash flow, reflecting higher realized prices and initial Vares contributions, while reiterating full-year guidance and a disciplined, self-funded growth posture.
Potential Risks
Vares' execution is the key variable, since ramp issues could pressure costs and sentiment. The footprint also brings permitting and country risk in the Balkans and Bulgaria, and cash flow will stay tightly linked to gold and by-product swings.
Forecast
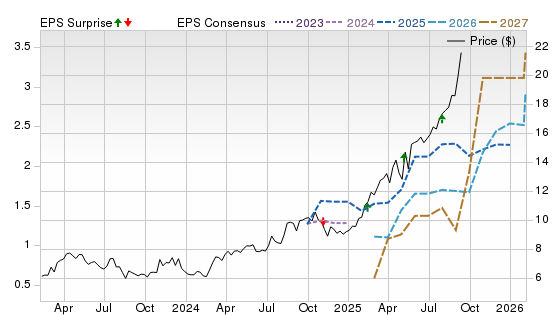
A Zacks Rank 2 (Buy) with a Value Score of C, Growth Score of C, and Momentum Score of B points to an improving trend but limited valuation support. The Price, Consensus & EPS Surprise chart pairs a steep price move with rising 2026 and 2027 consensus EPS lines and more recent upside surprises, implying estimates are being revised up as visibility improves.
This is our short term rating system that serves as a timeliness indicator for stocks over the next 1 to 3 months. How good is it? See rankings and related performance below.
The Zacks Industry Rank assigns a rating to each of the 265 X (Expanded) Industries based on their average Zacks Rank.
An industry with a larger percentage of Zacks Rank #1's and #2's will have a better average Zacks Rank than one with a larger percentage of Zacks Rank #4's and #5's.
The industry with the best average Zacks Rank would be considered the top industry (1 out of 265), which would place it in the top 1% of Zacks Ranked Industries. The industry with the worst average Zacks Rank (265 out of 265) would place in the bottom 1%.
The Zacks Sector Rank assigns a rating to each of the 16 Sectors based on their average Zacks Rank.
A sector with a larger percentage of Zacks Rank #1's and #2's will have a better average Zacks Rank than one with a larger percentage of Zacks Rank #4's and #5's.
The sector with the best average Zacks Rank would be considered the top sector (1 out of 16), which would place it in the top 1% of Zacks Ranked Sectors. The sector with the worst average Zacks Rank (16 out of 16) would place in the bottom 1%.
The Style Scores are a complementary set of indicators to use alongside the Zacks Rank. It allows the user to better focus on the stocks that are the best fit for his or her personal trading style.
The scores are based on the trading styles of Value, Growth, and Momentum. There's also a VGM Score ('V' for Value, 'G' for Growth and 'M' for Momentum), which combines the weighted average of the individual style scores into one score.
Value ScoreA
Growth ScoreA
Momentum ScoreA
VGM ScoreA
Within each Score, stocks are graded into five groups: A, B, C, D and F. As you might remember from your school days, an A, is better than a B; a B is better than a C; a C is better than a D; and a D is better than an F.
As an investor, you want to buy stocks with the highest probability of success. That means you want to buy stocks with a Zacks Rank #1 or #2, Strong Buy or Buy, which also has a Score of an A or a B in your personal trading style.
Zacks Earnings ESP (Expected Surprise Prediction) looks to find companies that have recently seen positive earnings estimate revision activity. The idea is that more recent information is, generally speaking, more accurate and can be a better predictor of the future, which can give investors an advantage in earnings season.
The technique has proven to be very useful for finding positive surprises. In fact, when combining a Zacks Rank #3 or better and a positive Earnings ESP, stocks produced a positive surprise 70% of the time, while they also saw 28.3% annual returns on average, according to our 10 year backtest.
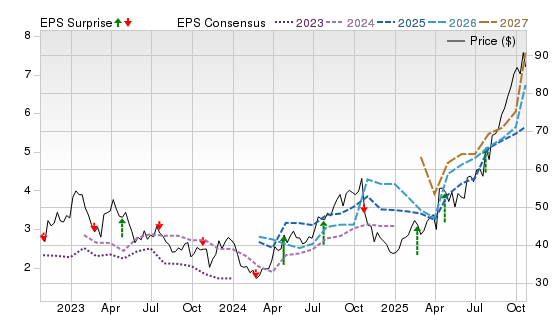
Kinross is a senior gold producer in the Americas and West Africa, providing direct leverage to bullion. In Q1 2026, it posted strong margins and record free cash flow, reflecting disciplined cost management while supporting dividends, buybacks, and a self-funded pipeline. A simpler portfolio after past divestitures helps keep execution focused.
Potential Risks
Shares can swing with gold, and diesel, labor, and processing inflation can squeeze all in sustaining margins. Operational variability at Tasiast and schedule risk around growth spending, including the Great Bear timeline, could also test confidence.
Forecast
A Zacks Rank 3 (Hold) with a Value Score of B, Growth Score of A, and Momentum Score of A signals constructive revisions and price strength. The chart shows a sharp price advance with higher 2026 and 2027 EPS lines and frequent upside surprises, suggesting estimates may keep edging up if execution holds.
This is our short term rating system that serves as a timeliness indicator for stocks over the next 1 to 3 months. How good is it? See rankings and related performance below.
The Zacks Industry Rank assigns a rating to each of the 265 X (Expanded) Industries based on their average Zacks Rank.
An industry with a larger percentage of Zacks Rank #1's and #2's will have a better average Zacks Rank than one with a larger percentage of Zacks Rank #4's and #5's.
The industry with the best average Zacks Rank would be considered the top industry (1 out of 265), which would place it in the top 1% of Zacks Ranked Industries. The industry with the worst average Zacks Rank (265 out of 265) would place in the bottom 1%.
The Zacks Sector Rank assigns a rating to each of the 16 Sectors based on their average Zacks Rank.
A sector with a larger percentage of Zacks Rank #1's and #2's will have a better average Zacks Rank than one with a larger percentage of Zacks Rank #4's and #5's.
The sector with the best average Zacks Rank would be considered the top sector (1 out of 16), which would place it in the top 1% of Zacks Ranked Sectors. The sector with the worst average Zacks Rank (16 out of 16) would place in the bottom 1%.
The Style Scores are a complementary set of indicators to use alongside the Zacks Rank. It allows the user to better focus on the stocks that are the best fit for his or her personal trading style.
The scores are based on the trading styles of Value, Growth, and Momentum. There's also a VGM Score ('V' for Value, 'G' for Growth and 'M' for Momentum), which combines the weighted average of the individual style scores into one score.
Value ScoreA
Growth ScoreA
Momentum ScoreA
VGM ScoreA
Within each Score, stocks are graded into five groups: A, B, C, D and F. As you might remember from your school days, an A, is better than a B; a B is better than a C; a C is better than a D; and a D is better than an F.
As an investor, you want to buy stocks with the highest probability of success. That means you want to buy stocks with a Zacks Rank #1 or #2, Strong Buy or Buy, which also has a Score of an A or a B in your personal trading style.
Zacks Earnings ESP (Expected Surprise Prediction) looks to find companies that have recently seen positive earnings estimate revision activity. The idea is that more recent information is, generally speaking, more accurate and can be a better predictor of the future, which can give investors an advantage in earnings season.
The technique has proven to be very useful for finding positive surprises. In fact, when combining a Zacks Rank #3 or better and a positive Earnings ESP, stocks produced a positive surprise 70% of the time, while they also saw 28.3% annual returns on average, according to our 10 year backtest.
Newmont is the largest listed gold miner, with diversified gold exposure and meaningful by-product copper and silver credits. In Q1 2026, it reported record earnings and free cash flow, supported by strong attributable production and lower by-product all-in sustaining costs versus the prior year, reinforcing the idea that scale can translate into cash returns when operations run smoothly. Management also leaned into productivity and capital discipline, which can sustain shareholder returns through the cycle.
Potential Risks
Scale brings risk too, so disruptions, permitting delays, or cost inflation can quickly hit results, and a gold pullback could curb cash flow and buybacks.
Forecast
A Zacks Rank 3 with a Value Score of B, Growth Score of A, and Momentum Score of B suggests steady, revision-driven support. The chart shows a price uptrend with 2026 and 2027 EPS lines moving higher and recent upside surprises, indicating analysts are nudging estimates up.
This is our short term rating system that serves as a timeliness indicator for stocks over the next 1 to 3 months. How good is it? See rankings and related performance below.
The Zacks Industry Rank assigns a rating to each of the 265 X (Expanded) Industries based on their average Zacks Rank.
An industry with a larger percentage of Zacks Rank #1's and #2's will have a better average Zacks Rank than one with a larger percentage of Zacks Rank #4's and #5's.
The industry with the best average Zacks Rank would be considered the top industry (1 out of 265), which would place it in the top 1% of Zacks Ranked Industries. The industry with the worst average Zacks Rank (265 out of 265) would place in the bottom 1%.
The Zacks Sector Rank assigns a rating to each of the 16 Sectors based on their average Zacks Rank.
A sector with a larger percentage of Zacks Rank #1's and #2's will have a better average Zacks Rank than one with a larger percentage of Zacks Rank #4's and #5's.
The sector with the best average Zacks Rank would be considered the top sector (1 out of 16), which would place it in the top 1% of Zacks Ranked Sectors. The sector with the worst average Zacks Rank (16 out of 16) would place in the bottom 1%.
The Style Scores are a complementary set of indicators to use alongside the Zacks Rank. It allows the user to better focus on the stocks that are the best fit for his or her personal trading style.
The scores are based on the trading styles of Value, Growth, and Momentum. There's also a VGM Score ('V' for Value, 'G' for Growth and 'M' for Momentum), which combines the weighted average of the individual style scores into one score.
Value ScoreA
Growth ScoreA
Momentum ScoreA
VGM ScoreA
Within each Score, stocks are graded into five groups: A, B, C, D and F. As you might remember from your school days, an A, is better than a B; a B is better than a C; a C is better than a D; and a D is better than an F.
As an investor, you want to buy stocks with the highest probability of success. That means you want to buy stocks with a Zacks Rank #1 or #2, Strong Buy or Buy, which also has a Score of an A or a B in your personal trading style.
Zacks Earnings ESP (Expected Surprise Prediction) looks to find companies that have recently seen positive earnings estimate revision activity. The idea is that more recent information is, generally speaking, more accurate and can be a better predictor of the future, which can give investors an advantage in earnings season.
The technique has proven to be very useful for finding positive surprises. In fact, when combining a Zacks Rank #3 or better and a positive Earnings ESP, stocks produced a positive surprise 70% of the time, while they also saw 28.3% annual returns on average, according to our 10 year backtest.
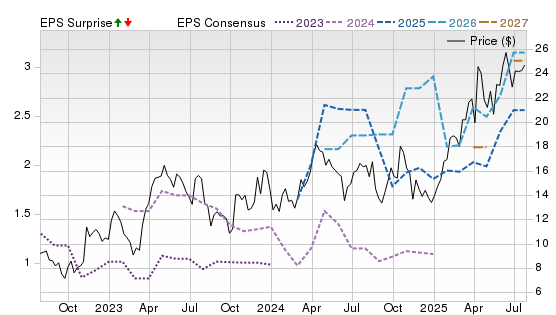
Centerra is a gold-copper producer with gold exposure led by Mount Milligan in Canada and the Oksut mine in Turkiye. In the latest quarter results tracked plan, better Oksut grades and steady Mount Milligan output supported solid free cash flow and a stronger cash balance versus a year ago. That liquidity supports buybacks and dividends and helps self-fund pipeline optionality.
Potential Risks
Cash flow is sensitive to both gold and copper, and the Turkiye backdrop adds geopolitical and regulatory uncertainty. Operational variability at Mount Milligan, plus capital allocation missteps on projects such as Kemess, could pressure valuation.
Forecast
A Zacks Rank 3 with a Value Score of A, Growth Score of C, and Momentum Score of A suggests value and trend support despite softer growth signals. The chart shows a rising price path with higher 2026 and 2027 EPS lines and more recent positive surprises, pointing to incremental upward revisions.
This is our short term rating system that serves as a timeliness indicator for stocks over the next 1 to 3 months. How good is it? See rankings and related performance below.
The Zacks Industry Rank assigns a rating to each of the 265 X (Expanded) Industries based on their average Zacks Rank.
An industry with a larger percentage of Zacks Rank #1's and #2's will have a better average Zacks Rank than one with a larger percentage of Zacks Rank #4's and #5's.
The industry with the best average Zacks Rank would be considered the top industry (1 out of 265), which would place it in the top 1% of Zacks Ranked Industries. The industry with the worst average Zacks Rank (265 out of 265) would place in the bottom 1%.
The Zacks Sector Rank assigns a rating to each of the 16 Sectors based on their average Zacks Rank.
A sector with a larger percentage of Zacks Rank #1's and #2's will have a better average Zacks Rank than one with a larger percentage of Zacks Rank #4's and #5's.
The sector with the best average Zacks Rank would be considered the top sector (1 out of 16), which would place it in the top 1% of Zacks Ranked Sectors. The sector with the worst average Zacks Rank (16 out of 16) would place in the bottom 1%.
The Style Scores are a complementary set of indicators to use alongside the Zacks Rank. It allows the user to better focus on the stocks that are the best fit for his or her personal trading style.
The scores are based on the trading styles of Value, Growth, and Momentum. There's also a VGM Score ('V' for Value, 'G' for Growth and 'M' for Momentum), which combines the weighted average of the individual style scores into one score.
Value ScoreA
Growth ScoreA
Momentum ScoreA
VGM ScoreA
Within each Score, stocks are graded into five groups: A, B, C, D and F. As you might remember from your school days, an A, is better than a B; a B is better than a C; a C is better than a D; and a D is better than an F.
As an investor, you want to buy stocks with the highest probability of success. That means you want to buy stocks with a Zacks Rank #1 or #2, Strong Buy or Buy, which also has a Score of an A or a B in your personal trading style.
Zacks Earnings ESP (Expected Surprise Prediction) looks to find companies that have recently seen positive earnings estimate revision activity. The idea is that more recent information is, generally speaking, more accurate and can be a better predictor of the future, which can give investors an advantage in earnings season.
The technique has proven to be very useful for finding positive surprises. In fact, when combining a Zacks Rank #3 or better and a positive Earnings ESP, stocks produced a positive surprise 70% of the time, while they also saw 28.3% annual returns on average, according to our 10 year backtest.
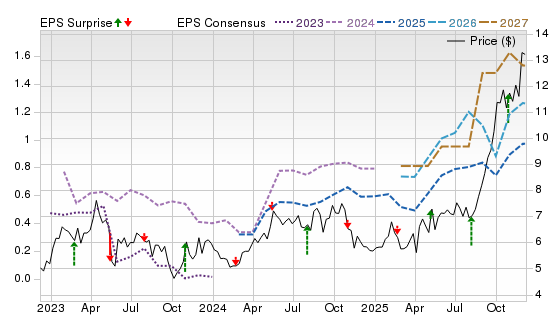
Gold Fields is a global gold miner with assets in South Africa, Ghana, Australia, and the Americas, giving investors broad exposure to gold cash flow. In its latest quarterly update, attributable gold equivalent production rose versus a year ago and management reaffirmed full-year volume and cost guidance, supporting confidence in steady delivery as higher gold prices lift margins.
Potential Risks
Input inflation is a key headwind, especially fuel and power, and logistics shocks can quickly raise costs. The company also faces operational variability across several mines, along with country risk and labor issues that can disrupt output.
Forecast
A Zacks Rank 3 with a Value Score of B, Growth Score of A, and Momentum Score of C signals earnings potential but softer trend support. The chart shows a strong price run with higher 2026 and 2027 EPS lines, while surprises are mixed but improving, consistent with rising estimates and choppier quarters.
The Zacks Rank is a proprietary stock-rating model that uses trends in earnings estimate revisions and earnings-per-share (EPS) surprises to classify stocks into five groups: #1 (Strong Buy), #2 (Buy), #3 (Hold), #4 (Sell) and #5 (Strong Sell). The Zacks Rank is calculated through four primary factors related to earnings estimates: analysts' consensus on earnings estimate revisions, the magnitude of revision change, the upside potential and estimate surprise (or the degree in which earnings per share deviated from the previous quarter).
Zacks builds the data from 3,000 analysts at over 150 different brokerage firms. The average yearly gain for Zacks Rank #1 (Strong Buy) stocks is +23.62% per year from January, 1988, through June 2, 2025.
Selections for Best Gold Stocks are based on the current top ranking stocks based on Zacks Indicator Score. For this list, only companies that have average daily trading volumes of 100,000 shares or more were considered. All information is current as of market open, May 7, 2026.
Guide to Gold Stocks
Is it a good time to invest in gold stocks right now?
Given that gold prices are already elevated and many forecasts point to further upside, now is considered a “reasonable time” by many analysts to consider gold stocks. The leverage effect of mining companies means they may outperform bullion if gold continues to rise. However, one must also be cautious: valuations for some stocks might already reflect part of the rally, and risks remain (see next). It’s prudent to size positions carefully and maintain diversification.
Benefits of investing in gold stocks
Operational leverage: As gold prices climb, miners’ margins expand because cost per ounce is relatively fixed.
Dividend potential: Some mature gold companies pay dividends or buy back shares, offering a yield component beyond price appreciation.
Portfolio diversification: Gold stocks can reduce correlation with typical growth stocks, providing a hedge in volatile markets.
Risks of investing in gold stocks
Operational & geological risk: Mining has many moving parts—cost overruns, mine disruptions, regulatory issues, jurisdiction risks.
Gold-price risk: If gold falls or stagnates (for example due to higher interest rates), miners will suffer in the opposite direction—sometimes more steeply.
Valuation risk: Stocks may already price in strong future gold prices; if those don’t materialize, downside exists.
Gold stocks vs Gold stocks ETF vs physical Gold
Physical Gold: You own actual bullion; no company risk, but you incur storage & insurance costs, no dividends, and liquidity might be lower.
Gold stocks: You get corporate leverage to gold price, potential dividends, but you assume company-specific risks.
Gold ETFs (physical bullion): Track gold price directly, low cost, easy to trade, no storage issues—but they don’t offer dividends or operations upside.
Gold-mining ETFs: Bundle many gold stocks—diversifies company risk but still carries mining equity risk—and may amplify upside or downside relative to bullion.
How to Select the Best Gold Stocks
When evaluating individual gold names:
Check cost per ounce (all-in sustaining cost) and production profile.
Verify debt levels and balance-sheet health.
Look for a diversified asset base (geography, mine life).
Dividend or buyback policy.
Management track-record and governance.
Valuation relative to peers and forward earnings.
Gold stocks vs Silver stocks: Which one is better?
Silver stocks offer exposure to both precious-metal demand and industrial applications (solar panels, EVs, electronics), which creates a different demand profile. That said, silver often underperforms gold during safe-haven rushes and may carry extra cyclicality. For investors focused purely on a hedge or safe-haven, gold stocks are often the preferred choice—but mixing both may enhance diversification.
Market Trend and Forecast about Gold Stocks
What factors are driving gold prices?
Key drivers include:
Central-bank buying of gold as part of reserves diversification.
A weak U.S. dollar and lower real interest rates make gold more attractive (because gold yields no interest).
Geopolitical uncertainty and inflation concerns push investors toward safe-haven assets.
For miners: higher gold price, stable or declining costs per ounce, improved cash flows.
How do gold stocks perform during inflation or recession?
Historically, gold and gold-stocks have had better relative performance during periods of high inflation or economic stress—thanks to their hedge status. In recessions, while equities may falter, gold may hold its value or rise, which can support gold stocks. That said, mining companies may face production or cost pressures during downturns, so while the metal may hold up, company risks still exist.
Are gold mining stocks undervalued right now?
According to some research, yes. For example, one note points out that while gold has rallied significantly, many mining companies’ valuations remain conservative relative to the metal’s price — offering potential upside if the rally continues. Still, because many investors have already rotated into the sector, valuations may be less of a bargain than in past cycles.
Will rising Interest rates hurt gold mining companies?
Rising real (inflation-adjusted) interest rates typically increase the opportunity cost of holding non-yielding assets like gold, which can weigh on gold prices—and thus miners. Additionally, higher rates increase costs for mining firms that borrow. On the flip side, if higher rates reflect inflation-risk or weakness in the economy, gold may benefit. So the net impact depends on the underlying cause of rate increases.
Gold ETFs and Alternatives
Are gold ETFs better than individual gold stocks?
If your primary goal is to track the price of gold (for example as a hedge) rather than pick specific companies, ETFs that hold physical gold may be a simpler, lower-risk approach. They eliminate much of the company-specific risk inherent in mining stocks. On the other hand, stock exposure offers the possibility of outsized returns (when gold rises) via operational leverage—but also greater downside.
Should I invest in gold mutual funds or ETFs? Where is the difference?
Gold ETFs typically offer direct exposure, low expense ratios, high liquidity, and transparent holdings.
Gold mutual funds may invest in a mix of gold stocks, sometimes along with other precious-metal companies, and may have higher fees or minimums. For many self-directed investors, ETFs are more efficient.
Which is appropriate depends on your tax situation, jurisdiction, and preferred investment vehicle.
Should I invest in gold for diversification or growth?
Gold is most commonly used as a diversifier—to reduce portfolio risk, hedge inflation, or provide safe-haven exposure. If you’re seeking growth, gold stocks (especially mining companies) may offer upside—but with higher risk. Understand the role you want gold to play in your portfolio before choosing.
How do dividends from gold companies compare to other sectors?
Many gold mining companies may pay dividends or buy back shares, but yields generally tend to be lower than high-dividend sectors such as utilities or REITs. Because their cash-flows are heavily dependent on commodity prices, dividends may be more variable and less predictable. Royalty/streaming companies often offer steadier payouts.
Best way to diversify with silver in a portfolio
Silver provides a related yet distinct exposure: it is both a precious metal and an industrial metal. To diversify with silver: consider silver-mining stocks or silver ETFs; assess how it correlates with gold and your broader portfolio; keep allocation moderate since silver can be more volatile. Pairing gold and silver may add another dimension of diversification.
Should I invest $1,000 Right now in Gold Stocks and What Will It Look Like?
If you invest $1,000 today in a basket of gold stocks or a gold-stock oriented ETF, here’s a simplified illustration:
Suppose gold rises by 20% over the next year and miners, benefiting from operational leverage, rise by 30%.
A $1,000 investment grows to $1,300 (assuming no fees/dividends).
If instead gold stagnates or falls 10%, miners might fall 15-20% due to the leveraged effect, and you’d end up around $800-$850.
This underlines both the opportunity and risk. A prudent approach: allocate only a portion of your portfolio (e.g., 5-10%) to gold stocks, have a longer time horizon (3-5 years or more), and monitor costs, valuations, the macro backdrop, and company fundamentals.
Common Questions About Gold Stocks
Do gold stocks pay dividends?
Yes—many established gold companies (especially large-caps or royalty/streaming firms) distribute dividends or execute buy-backs. However, payout levels depend on production, gold price, costs, and company capital allocation decisions.
What stocks are backed by gold?
While no stock is “backed” by gold in the same way that a bullion bar is backed, many mining companies’ profitability is tied directly to the gold price. Royalty or streaming companies may also offer quasi-“gold exposure” via agreements to buy gold production at fixed prices.
Is Warren Buffett buying gold?
Historically, Buffett has expressed skepticism toward gold as a productive investment and has favoured businesses generating cash flow rather than commodities per se. There’s no major reported shift recently indicating he’s investing heavily in gold or gold stocks. (As always, check the latest filings for updates.)


 Buy
Buy